| [2009-016442-74] Randomized placebo-controlled phase II trial of autologous mesenchymal stem cells (MSCs) in multiple sclerosis.
Original authors : Llufriu S, Sepulveda M, Blanco Y, Marin P, Moreno B, et al. Source : PLOS ONE | https://doi.org/10.1371/journal.pone.0113936 Download “Table 2009-016442-74-msc” 2009-016442-74-msc.zip – Downloaded 4 times – 1.24 MB Copyright : Unrestricted use of report data provided the original author and source are credited (raw royalty-free data). |
| Methods |
| Objective:
This randomized, double-blind, placebo-controlled, crossover phase II studies safety and efficacy of autologous mesenchymal stem cells in relapsing-remitting multiple sclerosis patients. Assessment: The study was performed in Hospital Clinic of Barcelona, Spain, between November 2010 and June 2012. Nine patients unresponsive to conventional therapy, defined by at least 1 relapse and/or GEL on MRI scan in past 12 months, disease duration 2 to 10 years and Expanded Disability Status Scale (EDSS) 3.0-6.5, were randomized to receive IV 1-2E+6 bone-marrow-derives-MSCs/kg or Placebo. After 6 months, the treatment was reversed and patients were followed-up for another 6 months. Primary outcome criteria of this study is therefore the change number of gadolinium-enhancing lesions (GEL) on magnetic at the end of the study. Secondary outcomes are (i) new lesions or enlarging lesions on serially registered long repetition time images, (ii) volume and percentage of brain volume change and (iii) clinical outcomes (relapses and disability by EDSS and MS Functional Composite). |
| Codings and variables generated following the freeze of the database | |
|---|---|
| Original variable(s) | Created variable |
| Disease duration (DIFONSET_ENTRY) | |
| Totalrelapses (TOTALRELAPSES) | Annualized relapse rate (ANNUALRELAPSES) resulting from an assignment (with DIFONSET_ENTRY TOTALRELAPSES) |
| EDSS_12m (EDSS_12M) | |
| EDSS_6m (EDSS_6M) | |
| EDSSbasal (EDSSBASAL) | EDSS change (EDSS) resulting from a listing (of EDSS_6M2 EDSS_12M2) |
| Flair_vol_12m (FLAIR_VOL_12M) | |
| Flair_vol_6m (FLAIR_VOL_6M) | |
| Flair_vol_bas (FLAIR_VOL_BAS) | Change in T2 lesion volume, ml (FLAIR_VOL) resulting from a listing (of FLAIR_VOL_6M2 FLAIR_VOL_12M2) |
| Flair_vol_bas (FLAIR_VOL_BAS) | T2 lesion volume, ml (FLAIR_VOL_BAS2) resulting from an assignment (with FLAIR_VOL_BAS) |
| Cumulative number of GEL (GAD_LESIONS_6M) | |
| Cumulative number of GEL (GAD_LESIONS_E) | |
| Number of GEL (GAD_LESIONS_BASAL) | Change in the number of GEL (GAD_LESIONS2) resulting from a listing (of GAD_LESIONS_6M2 GAD_LESIONS_E2) |
| N_T2_new_3m (N_T2_NEW_3M) | |
| N_T2_new_6m (N_T2_NEW_6M) | |
| N_T2_new_9m (N_T2_NEW_9M) | |
| N_T2_new_D (N_T2_NEW_D) | Number of new or enlarging T2 lesions (N_T2_NEW2) resulting from a listing (of N_T2_NEW_6M2 N_T2_NEW_D2) |
| Prior approved disease-modifying therapy (FIRSTLINE) :
– Betaferon – Ciclofosfamida – Copaxone – Rebif44 | Prior approved disease-modifying therapy (RECOD_FIRSTLINE) resulting from a recoding :
– 1 : Betaferon or ciclofosfamida – 2 : Copaxone – 3 : Rebif44 |
| No of relapses (TOTALRELAP_1STINF) | |
| No of relapses (TOTALRELAP_2NDINF) | No of relapses (TOTALRELAP) resulting from a listing (of TOTALRELAP_1STINF TOTALRELAP_2NDINF) |
| Grupo_tto (GRUPO_TTO) | |
| REPETITIONS | Group (TRAIT1) resulting from a conditioning (on GRUPO_TTO REPETITIONS) :
– MSCs – Placebo |
| Percentage of brain volume change, % (VOL_6MTO12M) | |
| Percentage of brain volume change, % (VOL_BASELTO6M) | Percentage of brain volume change, % (VOL_BASELTO) resulting from a listing (of VOL_BASELTO6M VOL_6MTO12M) |
| MSFC, z score (ZMSFCS_BASAL) | |
| ZMSFC_12m (ZMSFC_12M) | |
| ZMSFC_6m (ZMSFC_6M) | MSFC z-score change (ZMSFC) resulting from a listing (of ZMSFC_6M2 ZMSFC_12M2) |
| Table 1 : Encodings |
| Study principles | |
|---|---|
| Descriptions | Qualitative variables are described with frequencies and level percentages.
Quantitative variables are described with means and standard deviations, quartiles, minimum/maximum. |
| Associations | The association between a quantitative parameter and « Group (TRAIT1) » item was evaluated with Student(Sd) test (paired samples), Wilcoxon(Wc) sign test or Friedman(Fm) test depending on the conditions of validity.
The association between a qualitative parameter and « Group (TRAIT1) » item was evaluated with Mc Nemar(MN) test or Cochran(Cc) test. |
| Paired analysis | The association strength of the treatment with « Change in the number of GEL (GAD_LESIONS2) » item was evaluated and retranscribed as Mean differences with 95% confidence intervals and using Wald statistic. |
| Table 2 : Study principles |
| Flowchart |
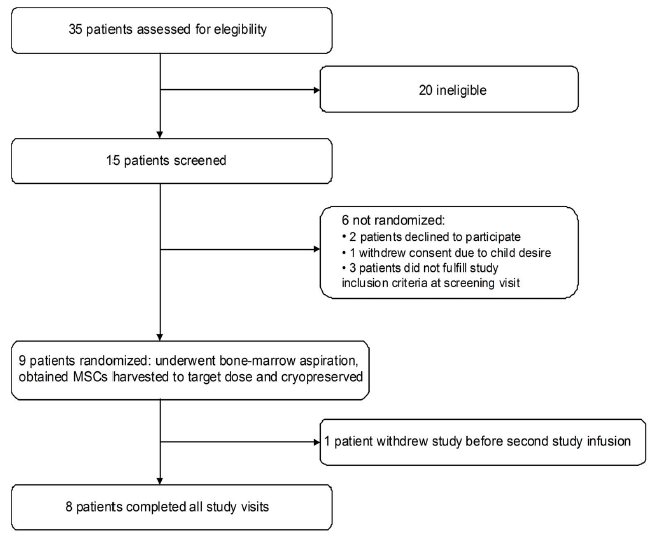 |
| Figure 1 : Flowchart |
| Results : Initial characteristics |
| Population | Group (TRAIT1) | ||||||
|---|---|---|---|---|---|---|---|
| _ | MSCs | Placebo | |||||
| N=18 | N=9 | N=9 | |||||
| Mean±SD
Med(Q1Q3) Min-Max or | Mean±SD
Med(Q1Q3) Min-Max or | Mean±SD
Med(Q1Q3) Min-Max or | |||||
| Variable | n | %col | n | %col | n | %col | |
| Gender (GENDER) | man | 4 | 22.2 | 2 | 22.2 | 2 | 22.2 |
| woman | 14 | 77.8 | 7 | 77.8 | 7 | 77.8 | |
| Total | 18 | 100 | 9 | 50 | 9 | 50 | |
| Age (AGE_ENTRY) | Mean ±SD | 36.78 | ±8.17 | 36.78 | ±8.42 | 36.78 | ±8.42 |
| Median (Q1-Q3) | 41 | (30-43) | 41 | (30-43) | 41 | (30-43) | |
| Min-Max | 23 | 48 | 23 | 48 | 23 | 48 | |
| Disease duration (DIFONSET_ENTRY) | Mean ±SD | 8.26 | ±2.52 | 8.26 | ±2.59 | 8.26 | ±2.59 |
| Median (Q1-Q3) | 9.08 | (7.25-9.33) | 9.08 | (7.25-9.33) | 9.08 | (7.25-9.33) | |
| Min-Max | 4.25 | 12.5 | 4.25 | 12.5 | 4.25 | 12.5 | |
| Relapses in previous 2 years (RELAPSES_2LASTY) | Mean ±SD | 2.44 | ±1.29 | 2.44 | ±1.33 | 2.44 | ±1.33 |
| Median (Q1-Q3) | 2 | (2-3) | 2 | (2-3) | 2 | (2-3) | |
| Min-Max | 1 | 5 | 1 | 5 | 1 | 5 | |
| Relapses in the last year (RELAPSE_LASTYEAR) | Mean ±SD | 1.67 | ±0.84 | 1.67 | ±0.87 | 1.67 | ±0.87 |
| Median (Q1-Q3) | 1 | (1-2) | 1 | (1-2) | 1 | (1-2) | |
| Min-Max | 1 | 3 | 1 | 3 | 1 | 3 | |
| Annualized relapse rate (ANNUALRELAPSES) | Mean ±SD | 1.04 | ±0.49 | 1.04 | ±0.51 | 1.04 | ±0.51 |
| Median (Q1-Q3) | 0.9 | (0.63-1.52) | 0.9 | (0.63-1.52) | 0.9 | (0.63-1.52) | |
| Min-Max | 0.55 | 1.84 | 0.55 | 1.84 | 0.55 | 1.84 | |
| EDSS (EDSSATENTRY) | Mean ±SD | 4 | ±0.91 | 4 | ±0.94 | 4 | ±0.94 |
| Median (Q1-Q3) | 3.5 | (3.5-4) | 3.5 | (3.5-4) | 3.5 | (3.5-4) | |
| Min-Max | 3 | 6 | 3 | 6 | 3 | 6 | |
| Time to EDSS 3.0 (years) (YEDSS3) | Mean ±SD | 6.67 | ±1.99 | 6.67 | ±2.05 | 6.67 | ±2.05 |
| Median (Q1-Q3) | 7 | (5.5-7.5) | 7 | (5.5-7.5) | 7 | (5.5-7.5) | |
| Min-Max | 3.8 | 10 | 3.8 | 10 | 3.8 | 10 | |
| Time to EDSS 4.0 (years) (YEDSS4) | Mean ±SD | 7.27 | ±3.22 | 7.27 | ±3.48 | 7.27 | ±3.48 |
| Median (Q1-Q3) | 6.67 | (4.88-9.67) | 6.67 | (4.88-9.67) | 6.67 | (4.88-9.67) | |
| Min-Max | 3.75 | 12 | 3.75 | 12 | 3.75 | 12 | |
| Time to EDSS 6.0 (years) (YEDSS6) | Mean ±SD | 8 | ±0 | 8 | ±0 | 8 | ±0 |
| Median (Q1-Q3) | 8 | (8-8) | 8 | (8-8) | 8 | (8-8) | |
| Min-Max | 8 | 8 | 8 | 8 | 8 | 8 | |
| MSFC, z score (ZMSFCS_BASAL) | Mean ±SD | -0.3 | ±0.51 | -0.3 | ±0.52 | -0.3 | ±0.52 |
| Median (Q1-Q3) | -0.28 | (-0.76–0.09) | -0.28 | (-0.76–0.09) | -0.28 | (-0.76–0.09) | |
| Min-Max | -1.01 | 0.48 | -1.01 | 0.48 | -1.01 | 0.48 | |
| MSSS (MSSSENTRY) | Mean ±SD | 5.82 | ±1.24 | 5.82 | ±1.28 | 5.82 | ±1.28 |
| Median (Q1-Q3) | 5.36 | (4.93-6.78) | 5.36 | (4.93-6.78) | 5.36 | (4.93-6.78) | |
| Min-Max | 4.17 | 7.65 | 4.17 | 7.65 | 4.17 | 7.65 | |
| Number of GEL (GAD_LESIONS_BASAL) | Mean ±SD | 4.67 | ±8.07 | 4.67 | ±8.32 | 4.67 | ±8.32 |
| Median (Q1-Q3) | 0 | (0-3) | 0 | (0-3) | 0 | (0-3) | |
| Min-Max | 0 | 22 | 0 | 22 | 0 | 22 | |
| T2 lesion volume, ml (FLAIR_VOL_BAS2) | Mean ±SD | 19.24 | ±15.74 | 19.24 | ±16.23 | 19.24 | ±16.23 |
| Median (Q1-Q3) | 16.27 | (12.84-20.83) | 16.27 | (12.84-20.83) | 16.27 | (12.84-20.83) | |
| Min-Max | 3.08 | 58.17 | 3.08 | 58.17 | 3.08 | 58.17 | |
| Prior approved disease-modifying therapy (RECOD_FIRSTLINE) | Betaferon or ciclofosfamida | 8 | 44.4 | 4 | 44.4 | 4 | 44.4 |
| Copaxone | 4 | 22.2 | 2 | 22.2 | 2 | 22.2 | |
| Rebif44 | 6 | 33.3 | 3 | 33.3 | 3 | 33.3 | |
| Total | 18 | 100 | 9 | 50 | 9 | 50 | |
| Table 3 : Initial characteristics cross sort |
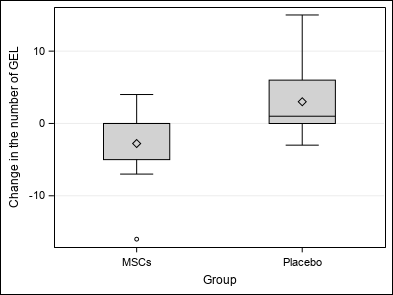
| Results : Primary outcome |
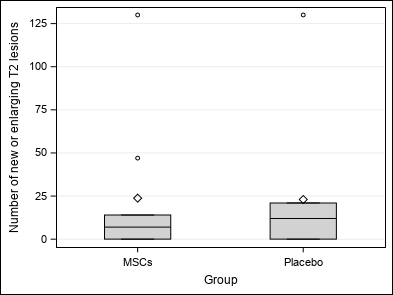
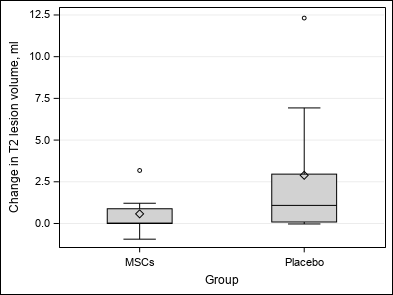
| At the end of the study, no association is highlighted between Group and number of GEL (p = 0.0938 / p = 0.0612), number of new or enlarging T2 lesions (p = 0.5625), volume and percentage of brain volume change (p = 0.2031 / p = 0.2500) and clinical outcomes (p = 1.0000 / p = 0.8125 / p = 0.9453).
However, a trend to reduced mean GEL in patients treated with MSCs is observed. |
| Population | Group (TRAIT1) | ||||
|---|---|---|---|---|---|
| _ | MSCs | Placebo | |||
| N=18 | N=9 | N=9 | Statistic | ||
| Variable | Mean±SD
Med(Q1Q3) Min-Max | Mean±SD
Med(Q1Q3) Min-Max | Mean±SD
Med(Q1Q3) Min-Max | p | |
| Change in the number of GEL (GAD_LESIONS2) | Mean ±SD | 0.11±6.22 | -2.78±5.89 | 3±5.36 | Wc p = 0.0938 |
| Median (Q1-Q3) | 0(-1-2) | 0(-5-0) | 1(0-6) | ||
| Min-Max | -16-15 | -16-4 | -3-15 | ||
| Wc : Wilcoxon | |||||
| Table 4 : Primary outcome cross sort |
| Change in the number of GEL (GAD_LESIONS2) | |||
|---|---|---|---|
| N=18 | n=18 | ||
| Variable | MD*[95%CI] | Wd p | |
| Group (TRAIT1) | MSCs | 0 | 0.0612 |
| Placebo | 5.778[-0.345 ; 11.900] | ||
| Wd : Wald *MD : Mean Difference | |||
| Table 5 : Association strength of treatment with primary outcome |
| Results : Secondary outcomes |
| Population | Group (TRAIT1) | ||||
|---|---|---|---|---|---|
| _ | MSCs | Placebo | |||
| N=18 | N=9 | N=9 | Statistic | ||
| Variable | Mean±SD
Med(Q1Q3) Min-Max | Mean±SD
Med(Q1Q3) Min-Max | Mean±SD
Med(Q1Q3) Min-Max | p | |
| Number of new or enlarging T2 lesions (N_T2_NEW2) | Mean ±SD | 23.39±40.47 | 23.78±42.42 | 23±40.99 | Wc p = 0.5625 |
| Median (Q1-Q3) | 9(0-21) | 7(0-14) | 12(0-21) | ||
| Min-Max | 0-130 | 0-130 | 0-130 | ||
| Change in T2 lesion volume, ml (FLAIR_VOL) | Mean ±SD | 1.73±3.2 | 0.58±1.17 | 2.89±4.16 | Wc p = 0.2031 |
| Median (Q1-Q3) | 0.78(0-1.88) | 0.02(0-0.88) | 1.08(0.09-2.96) | ||
| Min-Max | -0.94-12.32 | -0.94-3.18 | -0.03-12.32 | ||
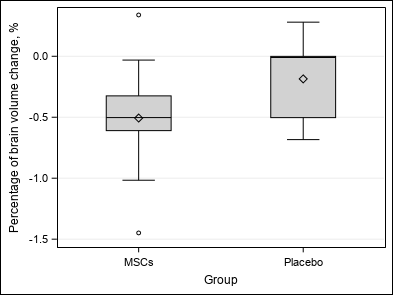
| Percentage of brain volume change, % (VOL_BASELTO) | Mean ±SD | -0.35±0.46 | -0.51±0.52 | -0.19±0.34 | Wc p = 0.2500 |
| Median (Q1-Q3) | -0.37(-0.59-0) | -0.5(-0.61–0.32) | -0.01(-0.5-0) | ||
| Min-Max | -1.45-0.34 | -1.45-0.34 | -0.68-0.28 | ||
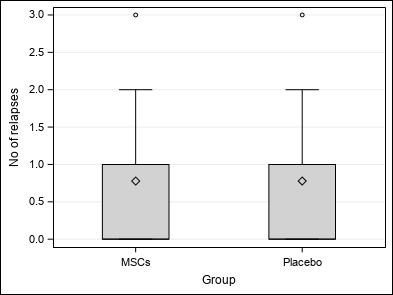
| No of relapses (TOTALRELAP) | Mean ±SD | 0.78±1.06 | 0.78±1.09 | 0.78±1.09 | Wc p = 1.0000 |
| Median (Q1-Q3) | 0(0-1) | 0(0-1) | 0(0-1) | ||
| Min-Max | 0-3 | 0-3 | 0-3 | ||
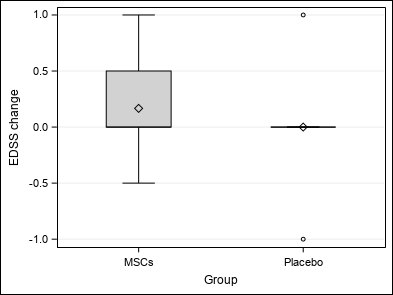
| EDSS change (EDSS) | Mean ±SD | 0.08±0.52 | 0.17±0.56 | 0±0.5 | Wc p = 0.8125 |
| Median (Q1-Q3) | 0(0-0) | 0(0-0.5) | 0(0-0) | ||
| Min-Max | -1-1 | -0.5-1 | -1-1 | ||
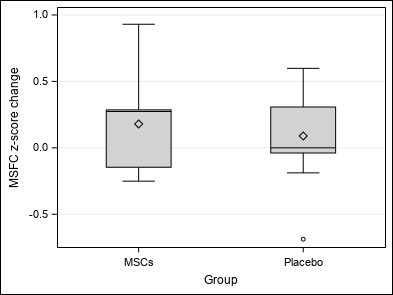
| MSFC z-score change (ZMSFC) | Mean ±SD | 0.13±0.38 | 0.18±0.38 | 0.09±0.4 | Wc p = 0.9453 |
| Median (Q1-Q3) | 0.11(-0.15-0.31) | 0.27(-0.15-0.29) | 0(-0.04-0.31) | ||
| Min-Max | -0.69-0.93 | -0.25-0.93 | -0.69-0.6 | ||
| Wc : Wilcoxon | |||||
| Table 6 : Secondary outcomes cross sort |
| Tables and figures |
| Table 1 : Encodings |
| Table 2 : Study principles |
| Table 3 : Initial characteristics cross sort |
| Table 4 : Primary outcome cross sort |
| Table 5 : Association strength of treatment with primary outcome |
| Table 6 : Secondary outcomes cross sort |
| Figure 1 : Flowchart |
| Figure 2 : Primary outcome |
| Figure 3 : Secondary outcomes |
| Date of completion : 2 August 2020 |
| Implementer : RUS |
| Software version 0.1 |