| [2013-003354-24] Influence of exogenous growth hormone administration on circulating concentrations of a-klotho in healthy and chronic kidney disease subjects: a prospective single-center open case-control pilot study.
Aaltje Y. Adema, Camiel L. M. de Roij van Zuijdewijn, Joost G. Hoenderop, Martin H. de Borst, Piet M. Ter Wee, et al. Source : PLOS ONE | https://doi.org/10.1186/s12882-018-1114-z Download “Table 2013-003354-24-ckd” 2013-003354-24-ckd.zip – Downloaded 3 times – 1.10 MB Copyright : Unrestricted use of report data provided the original author and source are credited (raw royalty-free data). |
| Summary |
| Methods |
| Objective:
Aim of the study is to evaluate the effect of exogenous growth hormone (GH) administration on a-Klotho concentrations in a clinical cohort with mild chronic kidney disease (CKD) and healthy subjects. Assessment: A prospective, single-center open case-control pilot study was performed involving 8 patients with CKD and 8 healthy controls matched for age and sex. In total, 18 subjects (12 men and 6 women) with or without CKD stage 3 according to the Chronic Kidney Disease Epidemiology Collaboration (CKD-EPI) were included in the period of January 2015 until March 2016 from the outpatient clinic of nephrology in the VU medical center, Amsterdam, The Netherlands. All included subjects received subcutaneous GH injections for 7 consecutive days. The primary end point is the change in a-Klotho concentrations after 7 days of GH-administration. Secondary endpoint is the potential difference in change of a-Klotho concentration between patients with CKD and healthy subjects. Study principles: Qualitative variables are described with frequencies and level percentages (Column percentages here). Quantitative variables are described with means and standard deviations, quartiles, minimum/maximum, 95% confidence intervals. As the parametric tests conditions of validity were not respected: The association between a quantitative parameter and « Group (GROUP) » item was evaluated with Mann-Whitney(MW) test. The association between a qualitative parameter and « Group (GROUP) » item was evaluated with Fisher(Fs) exact test. The analyzes were carried out using logistic and linear mixed regressions. |
| Warning, at least one selection of observation(s) was made on the initial database. |
| Codings and variables generated following the freeze of the database | |
|---|---|
| Original variable(s) | Created variable |
| Date of birth (DATE_OF_BIRTH) | |
| Visit date 1 (VISIT_DATE_1) | Age (AGE) resulting from an assignment (with DATE_OF_BIRTH VISIT_DATE_1) |
| A-Klotho v2 (pg/mL) (AKLOTHO_2) | |
| A-Klotho v3 (pg/mL) (AKLOTHO_3) | A-Klotho (pg/mL) (AKLOTHO) resulting from a listing (of AKLOTHO_2 AKLOTHO_3) |
| Height v1 (cm) (HEIGHT_1) | |
| Weight v1 (kg) (WEIGHT_1) | BMI (kg/m2) (BMI) resulting from an assignment (with HEIGHT_1 WEIGHT_1) |
| CFGF23 v2 (RU/mL) (CFGF23_2) | |
| CFGF23 v3 (RU/mL) (CFGF23_3) | CFGF23 (RU/mL) (CFGF23) resulting from a listing (of CFGF23_2 CFGF23_3) |
| IGF-1 v2 (nmol/L) (IGF1_2) | |
| IGF-1 v3 (nmol/L) (IGF1_3) | IGF-1 (nmol/L) (IGF1) resulting from a listing (of IGF1_2 IGF1_3) |
| Group (GROUP) :
– 1 : CKD stage III – 2 : Healthy controls | |
| REPETITIONS | Visit according to Group (ORD_GROUP_COD_VISIT) resulting from a ordinalization :
– 1 : CKD stage III, Baseline – 2 : CKD stage III, After 1 week of GH treatment – 3 : Healthy controls, Baseline – 4 : Healthy controls, After 1 week of GH treatment |
| PTH v2 (pmol/L) (PTH_2) | |
| PTH v3 (pmol/L) (PTH_3) | PTH (pmol/L) (PTH) resulting from a listing (of PTH_2 PTH_3) |
| Serum phosphate v2 (mmol/L) (SERUM_PHOSPHATE_2) | |
| Serum phosphate v3 (mmol/L) (SERUM_PHOSPHATE_3) | Serum phosphate (mmol/L) (SERUM_PHOSPHATE) resulting from a listing (of SERUM_PHOSPHATE_2 SERUM_PHOSPHATE_3) |
| TMP/GFR v2 (mmol/L) (TMP_GFR_2) | |
| TMP/GFR v3 (mmol/L) (TMP_GFR_3) | TMP/GFR (mmol/L) (TMP_GFR) resulting from a listing (of TMP_GFR_2 TMP_GFR_3) |
| Urinary phosphate excretion v2 (mmol/L) (URINARY_PHOSPHATE_2) | |
| Urinary phosphate excretion v3 (mmol/L) (URINARY_PHOSPHATE_3) | Urinary phosphate excretion (mmol/L) (URINARY_PHOSPHATE) resulting from a listing (of URINARY_PHOSPHATE_2 URINARY_PHOSPHATE_3) |
| REPETITIONS | Visit (VISIT) resulting from a conditioning (on REPETITIONS) :
– After 1 week of GH treatment – Baseline |
| Table 1 : Encodings |
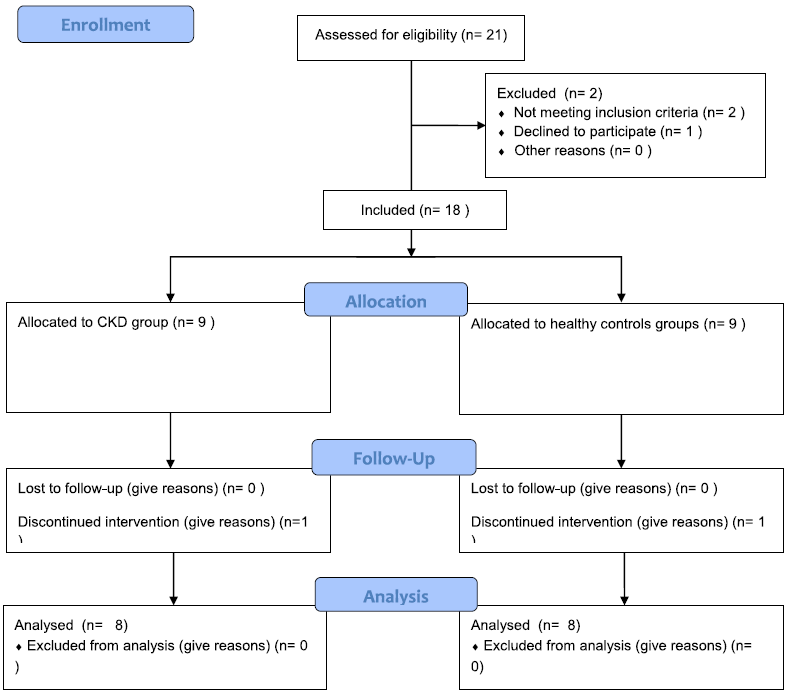
| 1. Study profile |
| 1.1. Flowchart |
| [Top of page] |
| Flowchart |
| Data on 16 subjects were analysed: 8 patients in the CKD-group and 8 in the healthy control group. |
| 2. Results |
| 2.1. Baseline characteristics of the participants |
| [Top of page] |
| Baseline characteristics are comparable between the groups, except for eGFR by definition of the groups. |
| Population | Group (GROUP) | |||||||
|---|---|---|---|---|---|---|---|---|
| _ | CKD stage III | Healthy controls | ||||||
| N=16 | N=8 | N=8 | ||||||
| Mean±SD
Med(Q1Q3) Min-Max 95%CI or | Mean±SD
Med(Q1Q3) Min-Max 95%CI or | Mean±SD
Med(Q1Q3) Min-Max 95%CI or | Statistic | |||||
| Variable | n | %col | n | %col | n | %col | p | |
| Age (AGE) | Mean ±SD | 46 | ±11.66 | 47.13 | ±12.87 | 44.88 | ±11.09 | MW p = 0.4306 |
| Median (Q1-Q3) | 51.5 | (35.5-55.5) | 52.5 | (36.5-57.5) | 51.5 | (35-52.5) | ||
| Min-Max | 25 | 59 | 25 | 59 | 26 | 55 | ||
| 95% CI | 39.79 | 52.21 | 36.37 | 57.88 | 35.6 | 54.15 | ||
| Sex (SEX) | Male | 10 | 62.5 | 5 | 62.5 | 5 | 62.5 | Fs p = 1.0000 |
| Female | 6 | 37.5 | 3 | 37.5 | 3 | 37.5 | ||
| Total | 16 | 100 | 8 | 50 | 8 | 50 | ||
| BMI (kg/m2) (BMI) | Mean ±SD | 24.5 | ±2.85 | 23.44 | ±2.78 | 25.71 | ±2.59 | MW p = 0.1832 |
| Median (Q1-Q3) | 24.56 | (21.56-27.64) | 22.12 | (21.48-25.81) | 26.09 | (23.76-27.79) | ||
| Min-Max | 20.69 | 28.38 | 20.69 | 28.02 | 21.16 | 28.38 | ||
| 95% CI | 22.92 | 26.08 | 21.11 | 25.77 | 23.32 | 28.1 | ||
| Smoking (SMOKING) | Yes | 1 | 6.3 | 1 | 12.5 | 0 | 0 | Fs p = 1.0000 |
| No | 15 | 93.8 | 7 | 87.5 | 8 | 100 | ||
| Total | 16 | 100 | 8 | 50 | 8 | 50 | ||
| SBP v2 (mmHg) (SBP_2) | Mean ±SD | 133.47 | ±10.85 | 133.94 | ±12.53 | 133 | ±9.74 | MW p = 0.7132 |
| Median (Q1-Q3) | 134.25 | (129.5-138) | 135.5 | (129.5-139.75) | 133 | (129-136.75) | ||
| Min-Max | 109 | 153 | 109 | 153 | 116 | 150.5 | ||
| 95% CI | 127.69 | 139.25 | 123.46 | 144.41 | 124.86 | 141.14 | ||
| DBP v2 (mmHg) (DBP_2) | Mean ±SD | 80.13 | ±8.83 | 82.38 | ±10.69 | 77.88 | ±6.42 | MW p = 0.2691 |
| Median (Q1-Q3) | 79.75 | (74.25-85.75) | 82.25 | (77-89) | 78.5 | (73.5-83) | ||
| Min-Max | 63.5 | 99 | 63.5 | 99 | 67 | 86 | ||
| 95% CI | 75.42 | 84.83 | 73.44 | 91.31 | 72.5 | 83.25 | ||
| EGFR v2 (ml/min/1.73 m2) (EGFR_2) | Mean ±SD | 62.83 | ±19.65 | 52 | ±14.06 | 84.5 | ±3.87 | MW p = 0.0085 |
| Median (Q1-Q3) | 59 | (51.5-82) | 54.5 | (43.5-59) | 85.5 | (82-87) | ||
| Min-Max | 28 | 88 | 28 | 74 | 79 | 88 | ||
| 95% CI | 50.35 | 75.32 | 40.24 | 63.76 | 78.34 | 90.66 | ||
| IGF-1 v2 (nmol/L) (IGF1_2) | Mean ±SD | 26.75 | ±5.04 | 26.25 | ±2.76 | 27.25 | ±6.8 | MW p = 0.9150 |
| Median (Q1-Q3) | 27 | (24-27.5) | 26 | (24-28) | 27 | (24.5-27.5) | ||
| Min-Max | 18 | 42 | 23 | 31 | 18 | 42 | ||
| 95% CI | 24.06 | 29.44 | 23.94 | 28.56 | 21.57 | 32.93 | ||
| Serum phosphate v2 (mmol/L) (SERUM_PHOSPHATE_2) | Mean ±SD | 0.95 | ±0.16 | 0.89 | ±0.16 | 1.01 | ±0.16 | MW p = 0.1264 |
| Median (Q1-Q3) | 0.93 | (0.87-1.05) | 0.87 | (0.83-1) | 0.95 | (0.91-1.05) | ||
| Min-Max | 0.62 | 1.37 | 0.62 | 1.13 | 0.89 | 1.37 | ||
| 95% CI | 0.86 | 1.04 | 0.76 | 1.02 | 0.87 | 1.14 | ||
| PTH v2 (pmol/L) (PTH_2) | Mean ±SD | 6.01 | ±2.67 | 7.34 | ±3.12 | 4.69 | ±1.25 | MW p = 0.0738 |
| Median (Q1-Q3) | 5.4 | (4.45-6.65) | 6.65 | (5.05-9.85) | 4.8 | (4.45-5.4) | ||
| Min-Max | 2 | 12.1 | 3.5 | 12.1 | 2 | 6.2 | ||
| 95% CI | 4.59 | 7.44 | 4.73 | 9.95 | 3.64 | 5.73 | ||
| CFGF23 v2 (RU/mL) (CFGF23_2) | Mean ±SD | 98.75 | ±26.67 | 101.25 | ±26.65 | 96.25 | ±28.28 | MW p = 0.5635 |
| Median (Q1-Q3) | 96.5 | (80.5-116) | 99.5 | (83.5-126.5) | 92 | (80.5-103.5) | ||
| Min-Max | 59 | 157 | 59 | 132 | 61 | 157 | ||
| 95% CI | 84.54 | 112.96 | 78.97 | 123.53 | 72.61 | 119.89 | ||
| Albumin v2 (g/L) (ALBUMIN_2) | Mean ±SD | 38.13 | ±2.09 | 38.25 | ±2.05 | 38 | ±2.27 | MW p = 0.9573 |
| Median (Q1-Q3) | 38.5 | (37-40) | 38 | (37-40) | 39 | (36.5-39.5) | ||
| Min-Max | 34 | 41 | 35 | 41 | 34 | 40 | ||
| 95% CI | 37.01 | 39.24 | 36.53 | 39.97 | 36.1 | 39.9 | ||
| A-Klotho v2 (pg/mL) (AKLOTHO_2) | Mean ±SD | 587.56 | ±255.44 | 529 | ±131.96 | 646.13 | ±338.47 | MW p = 0.5992 |
| Median (Q1-Q3) | 553.5 | (406-657) | 553.5 | (393.5-657) | 546.5 | (433.5-689) | ||
| Min-Max | 358 | 1427 | 358 | 666 | 404 | 1427 | ||
| 95% CI | 451.45 | 723.68 | 418.68 | 639.32 | 363.15 | 929.1 | ||
| Fs : Fisher, MW : Mann-Whitney | ||||||||
| Table 2 : Results – Baseline characteristics of the participants – Cross sort |
| # BMI (kg/m2) (BMI) : 1 unavailable data, 1 individual whose the “Group (GROUP)” item is filled “Healthy controls” |
| # EGFR v2 (ml/min/1.73 m2) (EGFR_2) : 4 unavailable data, 4 individuals whose the “Group (GROUP)” item is filled “Healthy controls” |
| 2.2. Time related results between groups |
| [Top of page] |
| After 7 days of GH suppletion therapy (GHST), mean IGF-1 concentrations are significantly higher.
Thus, they go from 26.3 ±2.8 nmol/L to 59.8 ±20.5 nmol/L (OR 1.265, 95% CI 1.040 to 1.539) in the CKD-group and from 27.3 ±6.8 nmol/L to 63.6 ±15.6 nmol/L (OR 1.242, 95% CI 1.222 to 1.262) for healthy controls. |
| Visit according to Group | |||||
|---|---|---|---|---|---|
| CKD stage III, Baseline | CKD stage III, After 1 week of GH treatment | Healthy controls, Baseline | Healthy controls, After 1 week of GH treatment | ||
| N=8 | N=8 | N=8 | N=8 | ||
| Variable | Mean±SD
Med(Q1Q3) Min-Max 95%CI | Mean±SD
Med(Q1Q3) Min-Max 95%CI | Mean±SD
Med(Q1Q3) Min-Max 95%CI | Mean±SD
Med(Q1Q3) Min-Max 95%CI | |
| IGF-1 (nmol/L) (IGF1) | Mean ±SD | 26.25±2.76 | 59.75±20.53 | 27.25±6.8 | 63.63±15.58 |
| Median (Q1-Q3) | 26(24-28) | 57(49.5-76.5) | 27(24.5-27.5) | 65(50.5-72.5) | |
| Min-Max | 23-31 | 24-88 | 18-42 | 43-90 | |
| 95% CI | 23.94-28.56 | 42.59-76.91 | 21.57-32.93 | 50.6-76.65 | |
| Serum phosphate (mmol/L) (SERUM_PHOSPHATE) | Mean ±SD | 0.89±0.16 | 0.87±0.19 | 1.01±0.16 | 1.11±0.26 |
| Median (Q1-Q3) | 0.87(0.83-1) | 0.88(0.7-1.01) | 0.95(0.91-1.05) | 1.08(0.91-1.22) | |
| Min-Max | 0.62-1.13 | 0.65-1.16 | 0.89-1.37 | 0.81-1.63 | |
| 95% CI | 0.76-1.02 | 0.71-1.03 | 0.87-1.14 | 0.89-1.32 | |
| Urinary phosphate excretion (mmol/L) (URINARY_PHOSPHATE) | Mean ±SD | 17.41±9.31 | 14.43±5.75 | 23.09±10.9 | 35.96±21.96 |
| Median (Q1-Q3) | 14.8(12.85-17.3) | 14.55(9.4-19.65) | 20.35(14.25-31.7) | 27.3(19.45-60.3) | |
| Min-Max | 9.9-39.5 | 6.2-22 | 10.8-41.3 | 10.1-63.5 | |
| 95% CI | 9.63-25.2 | 9.62-19.23 | 13.97-32.2 | 17.6-54.32 | |
| TMP/GFR (mmol/L) (TMP_GFR) | Mean ±SD | 0.62±0.14 | 0.63±0.17 | 0.91±0.23 | 1.02±0.41 |
| Median (Q1-Q3) | 0.61(0.54-0.68) | 0.61(0.51-0.76) | 0.82(0.77-0.97) | 0.93(0.73-1.15) | |
| Min-Max | 0.39-0.88 | 0.38-0.92 | 0.74-1.44 | 0.65-1.93 | |
| 95% CI | 0.5-0.74 | 0.49-0.77 | 0.71-1.11 | 0.68-1.37 | |
| PTH (pmol/L) (PTH) | Mean ±SD | 7.34±3.12 | 6.4±2.31 | 4.69±1.25 | 5.24±1.18 |
| Median (Q1-Q3) | 6.65(5.05-9.85) | 6.5(4.75-7.7) | 4.8(4.45-5.4) | 5.5(4.3-6) | |
| Min-Max | 3.5-12.1 | 3-10.3 | 2-6.2 | 3.5-6.8 | |
| 95% CI | 4.73-9.95 | 4.47-8.33 | 3.64-5.73 | 4.25-6.23 | |
| CFGF23 (RU/mL) (CFGF23) | Mean ±SD | 101.25±26.65 | 129.13±16.37 | 96.25±28.28 | 120.63±23.29 |
| Median (Q1-Q3) | 99.5(83.5-126.5) | 132.5(116-138.5) | 92(80.5-103.5) | 114(102.5-134.5) | |
| Min-Max | 59-132 | 105-154 | 61-157 | 98-165 | |
| 95% CI | 78.97-123.53 | 115.44-142.81 | 72.61-119.89 | 101.15-140.1 | |
| A-Klotho (pg/mL) (AKLOTHO) | Mean ±SD | 529±131.96 | 625.38±325.07 | 646.13±338.47 | 711.88±256.32 |
| Median (Q1-Q3) | 553.5(393.5-657) | 590.5(366-718) | 546.5(433.5-689) | 654(538.5-748) | |
| Min-Max | 358-666 | 331-1323 | 404-1427 | 511-1303 | |
| 95% CI | 418.68-639.32 | 353.61-897.14 | 363.15-929.1 | 497.59-926.16 | |
| Table 3 : Results – Time related results between groups – Cross sort |
| Visit according to Group (ORD_GROUP_COD_VISIT) | |||||
|---|---|---|---|---|---|
| CKD stage III, After 1 week of GH treatment | Healthy controls, Baseline | Healthy controls, After 1 week of GH treatment | |||
| N=8 | N=8 | N=8 | |||
| Variable | OR*[95%CI] | OR*[95%CI] | OR*[95%CI] | p | |
| IGF-1 (nmol/L) (IGF1) | Ref – CKD stage III, Baseline
1.265[1.040 ; 1.539] | Ref – CKD stage III, Baseline
1.033[0.861 ; 1.240] | Ref – CKD stage III, Baseline
1.283[1.052 ; 1.565] | Wd p = 0.0410 | |
| Serum phosphate (mmol/L) (SERUM_PHOSPHATE) | Ref – CKD stage III, Baseline
0.449[<0.001 ; 275.3] | Ref – CKD stage III, Baseline
62.99[0.112 ; >999] | Ref – CKD stage III, Baseline
578.9[0.769 ; >999] | Wd p = 0.1670 | |
| Urinary phosphate excretion (mmol/L) (URINARY_PHOSPHATE) | Ref – CKD stage III, Baseline
0.938[0.805 ; 1.093] | Ref – CKD stage III, Baseline
1.052[0.949 ; 1.166] | Ref – CKD stage III, Baseline
1.103[0.994 ; 1.225] | Wd p = 0.1037 | |
| TMP/GFR (mmol/L) (TMP_GFR) | Ref – CKD stage III, Baseline
2.047[0.002 ; >999] | Ref – CKD stage III, Baseline
>999[6.820 ; >999] | Ref – CKD stage III, Baseline
>999[18.53 ; >999] | Wd p = 0.0559 | |
| PTH (pmol/L) (PTH) | Ref – CKD stage III, Baseline
0.846[0.552 ; 1.298] | Ref – CKD stage III, Baseline
0.471[0.234 ; 0.945] | Ref – CKD stage III, Baseline
0.600[0.331 ; 1.088] | Wd p = 0.1638 | |
| CFGF23 (RU/mL) (CFGF23) | Ref – CKD stage III, Baseline
1.055[1.003 ; 1.110] | Ref – CKD stage III, Baseline
0.990[0.948 ; 1.034] | Ref – CKD stage III, Baseline
1.037[0.990 ; 1.087] | Wd p = 0.0859 | |
| A-Klotho (pg/mL) (AKLOTHO) | Ref – CKD stage III, Baseline
1.002[0.997 ; 1.008] | Ref – CKD stage III, Baseline
1.003[0.997 ; 1.008] | Ref – CKD stage III, Baseline
1.003[0.998 ; 1.009] | Wd p = 0.6362 | |
| Wd : Wald *OR : Odds Ratio | |||||
| Table 4 : Results – Time related results between groups – Association strengths |
| 2.3. Analysis of AKlotho concentrations with mixed multivariate model |
| [Top of page] |
| A-Klotho concentrations are neither significantly different between CKD patients and healthy controls (p = 0.4089), nor significantly different after 7 days of GHST (p = 0.1015). |
| A-Klotho (pg mL) (AKLOTHO) | |||
|---|---|---|---|
| N=32 | n=32 | ||
| Variable | MD*[95%CI] | Wd p | |
| Group (GROUP) | CKD stage III | 0 | 0.4089 |
| Healthy controls | 86.500[-181.8 ; 354.83] | ||
| Visit (VISIT) | After 1 week of GH treatment | 0 | 0.1015 |
| Baseline | -96.38[-252.2 ; 59.487] | ||
| Wd : Wald *MD : Mean Difference | |||
| Table 5 : Results – Analysis of AKlotho concentrations with mixed multivariate model – Association strengths in multivariate analysis |
| Tables and figures |
| Table 1 : Encodings |
| Table 2 : Results – Baseline characteristics of the participants – Cross sort |
| Table 3 : Results – Time related results between groups – Cross sort |
| Table 4 : Results – Time related results between groups – Association strengths |
| Table 5 : Results – Analysis of AKlotho concentrations with mixed multivariate model – Association strengths in multivariate analysis |
| Figure 1 : Study profile – Flowchart – Flowchart |
| Date of completion : 3 June 2021 |
| Implementer : RUS |
| Software version 0.1 |