| [2013-001665-16] Intranasal sufentanil versus intravenous morphine for acute severe trauma pain: A double-blind randomized non-inferiority study.
Blancher M, Maignan M, Clapé C, Quesada J-L, Collomb-Muret R, Albasini F, et al. Source : PLOS ONE | https://doi.org/10.1371/journal.pmed.1002849 Download “Table 2013-001665-16-algofine” 2013-001665-16-algofine.zip – Downloaded 7 times – 1.59 MB Copyright : Unrestricted use of report data provided the original author and source are credited (raw royalty-free data). |
| Summary |
| Methods |
| Objective:
Aim of the study is to determine whether intranasal sufentanil (INS) for patients presenting to an emergency department with acute severe traumatic pain results in a reduction in pain intensity non-inferior to intravenous morphine (IVM). Assessment: A prospective, randomized, multicenter non-inferiority trial was conducted in the emergency departments of 6 hospitals across France. In total, 194 patients with acute traumatic pain were assessed for eligibility between November 4, 2013 and April 10, 2015: 157 were included in the emergency department cohort and randomized, 155 initiated the treatment and 136 respected the protocol administrations (69 IVM group, 67 INS group). Patients were randomized 1:1 to INS titration (0.3 µg/kg and additional doses of 0.15 µg/kg at 10 minutes and 20 minutes if numerical pain rating scale [NRS] was greater than 3) and intravenous placebo, or to IVM (0.1 mg/kg and additional doses of 0.05 mg/kg at 10 minutes and 20 minutes if NRS was greater than 3) and intranasal placebo. The primary endpoint is analgesia efficacy defined as a decrease in pain on the NRS between the first administration and 30 minutes later in per protocol population. The prespecified non-inferiority margin is -1.3 on the NRS. Secondary endpoints include analgesia efficacy at 10 and 20 minutes defined by a decrease in NRS, and the incidence of any serious and nonserious adverse events up to 4 hours after the first administration. Study principles: Qualitative variables are described with frequencies and level percentages (Column percentages here). Quantitative variables are described with means and standard deviations, quartiles, minimum/maximum, 95% confidence intervals. The association between a quantitative parameter and « Randomisation group (GROUP) » item was evaluated with the Student(Sd) test. The association between a qualitative parameter and « Randomisation group (GROUP) » item was evaluated with the Khi2(K2) test. The analyzes were carried out using paired linear regressions. |
| Warning, at least one selection of observation(s) was made on the initial database. |
| Codings and variables generated following the freeze of the database | |
|---|---|
| Original variable(s) | Created variable |
| Centre of inclusion (CENTRE) | Centre of inclusion (CENTRE2) resulting from a conditioning (on CENTRE) :
– Albertville – Annecy – Chambery – Grenoble (north site) – Grenoble (south site) – Saint-Jean-de-Maurienne – Voiron |
| Numerical pain rating scale at t0 (NRS_T0) | |
| Numerical pain rating scale at t10 (NRS_T10) | |
| Numerical pain rating scale at t20 (NRS_T20) | |
| Numerical pain rating scale at t30 (NRS_T30) | Numerical pain rating scale (NRS) resulting from a listing (of NRS_T0 NRS_T10 NRS_T20 NRS_T30) |
| Numerical pain rating scale at t0 (NRS_T0) | |
| Numerical pain rating scale at t30 (NRS_T30) | NRS difference between first administration and at 30 minutes (NRS2) resulting from an assignment (with NRS_T30 NRS_T0) |
| REPETITIONS | Time (ORD_COD_TIME) resulting from a ordinalization :
– 1 : At Baseline – 2 : At 10 minutes – 3 : At 20 minutes – 4 : At 30 minutes |
| REPETITIONS | |
| Randomisation group (GROUP) :
– 1 : Intravenous morphine – 2 : Intranasal Sufentanil | Time according to Randomisation group (ORD_GROUP_COD_TIME) resulting from a ordinalization :
– 1 : Intravenous morphine, At Baseline – 2 : Intravenous morphine, At 10 minutes – 3 : Intravenous morphine, At 20 minutes – 4 : Intravenous morphine, At 30 minutes – 5 : Intranasal Sufentanil, At Baseline – 6 : Intranasal Sufentanil, At 10 minutes – 7 : Intranasal Sufentanil, At 20 minutes – 8 : Intranasal Sufentanil, At 30 minutes |
| REPETITIONS | |
| Randomisation group (GROUP) :
– 1 : Intravenous morphine – 2 : Intranasal Sufentanil | Time according to Randomisation group (ORD_GROUP_COD_TIME2) resulting from a ordinalization :
– 1 : Intranasal Sufentanil, At Baseline – 2 : Intravenous morphine, At Baseline – 3 : Intranasal Sufentanil, At 10 minutes – 4 : Intravenous morphine, At 10 minutes – 5 : Intranasal Sufentanil, At 20 minutes – 6 : Intravenous morphine, At 20 minutes – 7 : Intranasal Sufentanil, At 30 minutes – 8 : Intravenous morphine, At 30 minutes |
| Table 1 : Encodings |
| 1. Study profile |
| 1.1. Flowchart |
| [Top of page] |
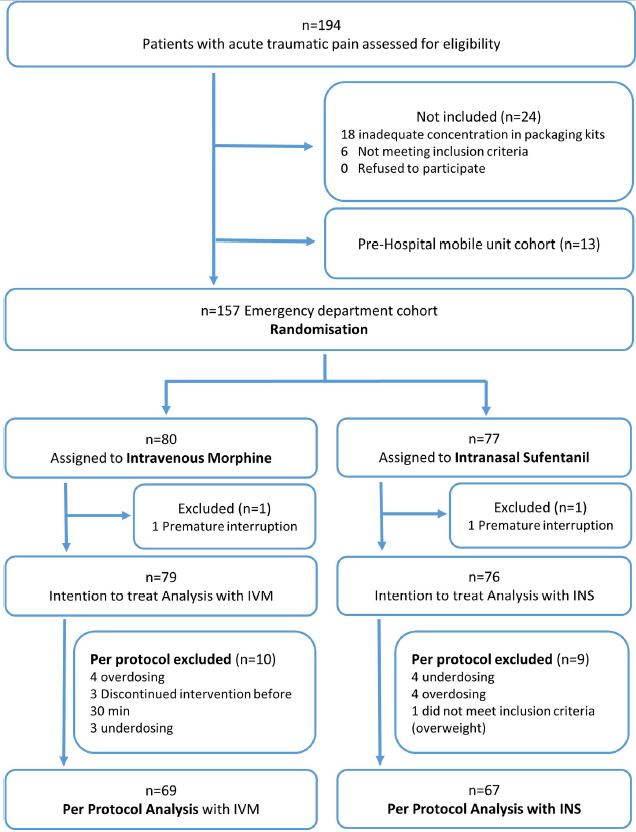
| Flowchart |
| Among 194 enrolled patients, 157 were randomized, and the protocol was correctly administered in 136: 69 were in IVM group, 67 in INS group (per protocol population). |
| 2. Results in per protocol population |
| 2.1. Baseline characteristics of the participants |
| [Top of page] |
| Baseline characteristics are comparable between the groups. |
| Population | Randomisation group (GROUP) | |||||||
|---|---|---|---|---|---|---|---|---|
| _ | Intravenous morphine | Intranasal Sufentanil | ||||||
| N=136 | N=69 | N=67 | ||||||
| Mean±SD
Med(Q1Q3) Min-Max 95%CI or | Mean±SD
Med(Q1Q3) Min-Max 95%CI or | Mean±SD
Med(Q1Q3) Min-Max 95%CI or | Statistic | |||||
| Variable | n | %col | n | %col | n | %col | p | |
| Age (AGE) | Mean ±SD | 42.13 | ±15.92 | 41.71 | ±16.21 | 42.55 | ±15.73 | Sd p = 0.7591 |
| Median (Q1-Q3) | 39 | (29-54.5) | 41 | (28-54) | 38 | (30-55) | ||
| Min-Max | 18 | 75 | 18 | 72 | 19 | 75 | ||
| 95% CI | 39.42 | 44.83 | 37.82 | 45.6 | 38.71 | 46.39 | ||
| Sex (SEX) | Male | 71 | 52.2 | 40 | 58 | 31 | 46.3 | K2 p = 0.1720 |
| Female | 65 | 47.8 | 29 | 42 | 36 | 53.7 | ||
| Total | 136 | 100 | 69 | 50.7 | 67 | 49.3 | ||
| Heart rate at t0 (HR_T0) | Mean ±SD | 77.75 | ±14.08 | 79.57 | ±15.21 | 75.88 | ±12.66 | Sd p = 0.1275 |
| Median (Q1-Q3) | 75 | (67.5-87.5) | 76 | (68-91) | 74 | (67-85) | ||
| Min-Max | 48 | 119 | 53 | 119 | 48 | 108 | ||
| 95% CI | 75.36 | 80.14 | 75.91 | 83.22 | 72.79 | 78.97 | ||
| Respiratory Rate at t0 (RR_T0) | Mean ±SD | 17.4 | ±4.31 | 16.95 | ±4.5 | 17.83 | ±4.1 | Sd p = 0.2492 |
| Median (Q1-Q3) | 17 | (15-20) | 16 | (15-18.5) | 18 | (15-20) | ||
| Min-Max | 10 | 40 | 10 | 40 | 11 | 32 | ||
| 95% CI | 16.64 | 18.15 | 15.83 | 18.08 | 16.81 | 18.85 | ||
| Oxygen saturation at t0 (SPO2_T0) | Mean ±SD | 98.26 | ±1.78 | 98.2 | ±1.88 | 98.31 | ±1.68 | Sd p = 0.7182 |
| Median (Q1-Q3) | 99 | (97-100) | 99 | (97-100) | 99 | (97-100) | ||
| Min-Max | 92 | 100 | 92 | 100 | 92 | 100 | ||
| 95% CI | 97.96 | 98.56 | 97.75 | 98.65 | 97.9 | 98.72 | ||
| Diastolic blood pressure at t0 (DIASTOLIC_AP_T0) | Mean ±SD | 79.17 | ±11.73 | 80.3 | ±11.47 | 78 | ±11.97 | Sd p = 0.2535 |
| Median (Q1-Q3) | 80 | (71-87) | 81 | (73-87) | 78 | (70-86) | ||
| Min-Max | 51 | 106 | 51 | 106 | 51 | 105 | ||
| 95% CI | 77.18 | 81.16 | 77.55 | 83.06 | 75.08 | 80.92 | ||
| Numerical pain rating scale at t0 (NRS_T0) | Mean ±SD | 7.76 | ±1.21 | 7.61 | ±1.15 | 7.93 | ±1.25 | Sd p = 0.1264 |
| Median (Q1-Q3) | 8 | (7-8) | 8 | (7-8) | 8 | (7-9) | ||
| Min-Max | 6 | 10 | 6 | 10 | 6 | 10 | ||
| 95% CI | 7.56 | 7.97 | 7.33 | 7.89 | 7.62 | 8.23 | ||
| Rescue analgesic administered after t30 (RESCUE_ANALGESIC) | Yes | 32 | 23.5 | 16 | 23.2 | 16 | 23.9 | K2 p = 0.9242 |
| No | 104 | 76.5 | 53 | 76.8 | 51 | 76.1 | ||
| Total | 136 | 100 | 69 | 50.7 | 67 | 49.3 | ||
| Centre of inclusion (CENTRE2) | Albertville | 6 | 4.4 | 3 | 4.3 | 3 | 4.5 | |
| Annecy | 17 | 12.5 | 9 | 13 | 8 | 11.9 | ||
| Chambery | 7 | 5.1 | 4 | 5.8 | 3 | 4.5 | ||
| Grenoble (north site) | 83 | 61 | 41 | 59.4 | 42 | 62.7 | ||
| Grenoble (south site) | 4 | 2.9 | 2 | 2.9 | 2 | 3 | ||
| Saint-Jean-de-Maurienne | 18 | 13.2 | 10 | 14.5 | 8 | 11.9 | ||
| Voiron | 1 | 0.7 | 0 | 0 | 1 | 1.5 | ||
| Total | 136 | 100 | 69 | 50.7 | 67 | 49.3 | ||
| K2 : Khi2, Sd : Student | ||||||||
| Table 2 : Results in per protocol population – Baseline characteristics of the participants – Cross sort |
| # Respiratory Rate at t0 (RR_T0) : 7 unavailable data, 2 individuals whose the “Randomisation group (GROUP)” item is filled “Intranasal Sufentanil” and 5 individuals whose the “Randomisation group (GROUP)” item is filled “Intravenous morphine” |
| 2.2. Results between groups at baseline and at 30 minutes |
| [Top of page] |
| As described in the table below, the mean NRS drops from 7.61 at the first administration to 3.52 at 30 minutes in the IVM group and from 7.93 to 2.73 in the INS group. |
| Time according to Randomisation group | |||||
|---|---|---|---|---|---|
| Intravenous morphine, At Baseline | Intravenous morphine, At 30 minutes | Intranasal Sufentanil, At Baseline | Intranasal Sufentanil, At 30 minutes | ||
| N=69 | N=69 | N=67 | N=67 | ||
| Variable | Mean±SD
Med(Q1Q3) Min-Max 95%CI | Mean±SD
Med(Q1Q3) Min-Max 95%CI | Mean±SD
Med(Q1Q3) Min-Max 95%CI | Mean±SD
Med(Q1Q3) Min-Max 95%CI | |
| Numerical pain rating scale (NRS) | Mean ±SD | 7.61±1.15 | 3.52±1.92 | 7.93±1.25 | 2.73±2.12 |
| Median (Q1-Q3) | 8(7-8) | 4(2-4) | 8(7-9) | 2(1-4) | |
| Min-Max | 6-10 | 0-9 | 6-10 | 0-8 | |
| 95% CI | 7.33-7.89 | 3.06-3.98 | 7.62-8.23 | 2.21-3.25 | |
| Table 3 : Results in per protocol population – Results between groups at baseline and at 30 minutes – Cross sort |
| 2.3. Analysis of NRS reduction between groups |
| [Top of page] |
| Non-inferiority is met, as the lower 97.5% confidence interval of 0.286 is greater than the prespecified non-inferiority margin of -1.3 (mean difference in NRS variation between groups: 1.107, 97.5% CI 0.286 to 1.928). |
| NRS difference between first administration and at 30 minutes (NRS2) | |||
|---|---|---|---|
| N=136 | |||
| Variable | MD*[97.5%CI] | ||
| Randomisation group (GROUP) | Intravenous morphine | 0 | n=136 |
| Intranasal Sufentanil | 1.107[ 0.286 ; 1.928] | ||
| *MD : Mean Difference | |||
| Table 4 : Results in per protocol population – Analysis of NRS reduction between groups – Association strengths in univariate analyzes |
| 2.4. Analysis of NRS with univariate linear mixed models |
| [Top of page] |
| A significant effect of treatment is observed on NRS according to time in the univariate linear mixed model (p < 0.0001). |
| Numerical pain rating scale (NRS) | |||
|---|---|---|---|
| N=544 | |||
| Variable | MD*[95%CI] | p | |
| Time (ORD_COD_TIME) | At Baseline | 0 | Wd p < 0.0001
n=544 |
| At 10 minutes | -2.243[-2.534 ; -1.951] | ||
| At 20 minutes | -3.772[-4.124 ; -3.420] | ||
| At 30 minutes | -4.632[-4.997 ; -4.268] | ||
| Time according to Randomisation group (ORD_GROUP_COD_TIME) | Intravenous morphine, At Baseline | 0 | Wd p < 0.0001
n=544 |
| Intravenous morphine, At 10 minutes | -2.391[-2.793 ; -1.989] | ||
| Intravenous morphine, At 20 minutes | -3.478[-3.956 ; -3.000] | ||
| Intravenous morphine, At 30 minutes | -4.087[-4.552 ; -3.622] | ||
| Intranasal Sufentanil, At Baseline | 0.317[-0.084 ; 0.718] | ||
| Intranasal Sufentanil, At 10 minutes | -1.773[-2.322 ; -1.224] | ||
| Intranasal Sufentanil, At 20 minutes | -3.758[-4.334 ; -3.182] | ||
| Intranasal Sufentanil, At 30 minutes | -4.877[-5.449 ; -4.305] | ||
| Wd : Wald *MD : Mean Difference | |||
| Table 5 : Results in per protocol population – Analysis of NRS with univariate linear mixed models – Association strengths in univariate analyzes |
| 2.5. Analysis of NRS with multivariate linear mixed model |
| [Top of page] |
| In the multivariate linear mixed model :
– A significant decrease in NRS is observed according to time (p < 0.0001). – An association is observed between treatment and NRS at 30 minutes (MD -0.790, 95% CI -1.466 to -0.114). |
| Numerical pain rating scale (NRS) | |||
|---|---|---|---|
| N=544 | n=544 | ||
| Variable | MD*[95%CI] | Wd p | |
| Randomisation group (GROUP) | Intravenous morphine | 0 | 0.8968 |
| Intranasal Sufentanil | 0.317[-0.084 ; 0.718] | ||
| Time (ORD_COD_TIME) | At Baseline | 0 | < 0.0001 |
| At 10 minutes | -2.391[-2.793 ; -1.989] | ||
| At 20 minutes | -3.478[-3.956 ; -3.000] | ||
| At 30 minutes | -4.087[-4.552 ; -3.622] | ||
| Wd : Wald *MD : Mean Difference | |||
| Table 6 : Results in per protocol population – Analysis of NRS with multivariate linear mixed model – Association strengths in multivariate analysis |
| Description | MD*[IC95%] |
|---|---|
| GROUP Intranasal Sufentanil vs Intravenous morphine in ORD_COD_TIME At 10 minutes | 0.618[-0.024 ; 1.261] |
| GROUP Intranasal Sufentanil vs Intravenous morphine in ORD_COD_TIME At 20 minutes | -0.280[-0.991 ; 0.431] |
| GROUP Intranasal Sufentanil vs Intravenous morphine in ORD_COD_TIME At 30 minutes | -0.790[-1.466 ; -0.114] |
| GROUP Intranasal Sufentanil vs Intravenous morphine in ORD_COD_TIME At Baseline | 0.317[-0.084 ; 0.718] |
| Table 7 : Results in per protocol population – Analysis of NRS with multivariate linear mixed model – Description of association strengths in multivariate analysis |
| 2.6. NRS at the different time points by group |
| [Top of page] |
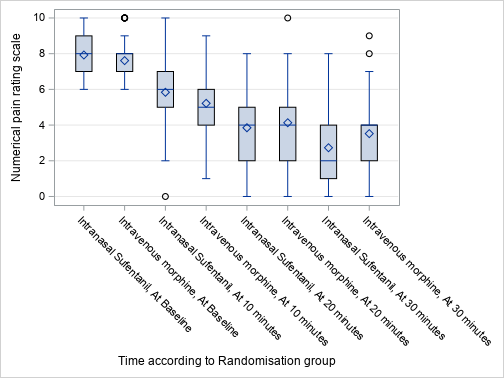 |
| Figure 2 : Results in per protocol population – NRS at the different time points by group – Graphics |
| 2.7. Adverse events observed |
| [Top of page] |
| There are no statistically significant differences between groups in recorded mild or serious adverse events. |
| Randomisation group | ||||||
|---|---|---|---|---|---|---|
| Intravenous morphine | Intranasal Sufentanil | |||||
| N=69 | N=67 | Statistic | ||||
| Variable | n | %col | n | %col | p | |
| An SpO2 <90% is observed (HYPOXEMIA) | Yes | 1 | 1.4 | 3 | 4.5 | Fs p = 0.3621 |
| A systolic blood pressure <90 mmHg is observed (HYPOTENSION) | Yes | 1 | 1.4 | 1 | 1.5 | Fs p = 1.0000 |
| A Respiratory rate <10/minute is observed (BRADYPNEA) | Yes | 0 | 0 | 2 | 3 | Fs p = 0.2408 |
| An anaphylactic_shock is observed (ANAPHYLACTIC_SHOCK) | No | 69 | 100 | 67 | 100 | |
| A Ramsay score >2 is observed (COMA) | No | 69 | 100 | 67 | 100 | |
| A heart rate bpm <45/min is observed (BRADYCARDIA) | No | 69 | 100 | 67 | 100 | |
| Patient required antidotal (naloxone) use (NAXOLONE) | No | 68 | 100 | 67 | 100 | |
| Dizziness is observed or declared (DIZZINESS) | Yes | 25 | 36.2 | 19 | 28.4 | K2 p = 0.3265 |
| Hot_flushes are declared (HOT_FLUSHES) | Yes | 20 | 29 | 12 | 17.9 | K2 p = 0.1279 |
| Nausea is observed or declared (NAUSEA) | Yes | 13 | 18.8 | 8 | 11.9 | K2 p = 0.2655 |
| Bad_taste is declared (BAD_TASTE) | Yes | 3 | 4.3 | 2 | 3 | Fs p = 1.0000 |
| Allergy is observed (ALLERGY) | Yes | 1 | 1.4 | 1 | 1.5 | Fs p = 1.0000 |
| Epistaxis is observed or declared (EPISTAXIS) | Yes | 1 | 1.4 | 0 | 0 | Fs p = 1.0000 |
| Hallucinations is observed or declared (HALLUCINATIONS) | No | 69 | 100 | 67 | 100 | |
| K2 : Khi2, Fs : Fisher | ||||||
| Table 8 : Results in per protocol population – Adverse events observed – Cross sort |
| # Patient required antidotal (naloxone) use (NAXOLONE) : 1 unavailable data, 1 individual whose the “Randomisation group (GROUP)” item is filled “Intravenous morphine” |
| 3. Results in intention to treat population |
| 3.1. Baseline characteristics of the participants |
| [Top of page] |
| Baseline characteristics are comparable between the groups. |
| Population | Randomisation group (GROUP) | |||||||
|---|---|---|---|---|---|---|---|---|
| _ | Intravenous morphine | Intranasal Sufentanil | ||||||
| N=155 | N=79 | N=76 | ||||||
| Mean±SD
Med(Q1Q3) Min-Max 95%CI or | Mean±SD
Med(Q1Q3) Min-Max 95%CI or | Mean±SD
Med(Q1Q3) Min-Max 95%CI or | Statistic | |||||
| Variable | n | %col | n | %col | n | %col | p | |
| Age (AGE) | Mean ±SD | 42.36 | ±16.18 | 42.01 | ±16.68 | 42.72 | ±15.76 | Sd p = 0.7855 |
| Median (Q1-Q3) | 40 | (29-55) | 41 | (25-56) | 39.5 | (30-54.5) | ||
| Min-Max | 18 | 75 | 18 | 73 | 19 | 75 | ||
| 95% CI | 39.79 | 44.93 | 38.28 | 45.75 | 39.12 | 46.33 | ||
| Sex (SEX) | Male | 83 | 53.5 | 47 | 59.5 | 36 | 47.4 | K2 p = 0.1303 |
| Female | 72 | 46.5 | 32 | 40.5 | 40 | 52.6 | ||
| Total | 155 | 100 | 79 | 51 | 76 | 49 | ||
| Heart rate at t0 (HR_T0) | Mean ±SD | 77.62 | ±14 | 79.05 | ±14.96 | 76.16 | ±12.89 | Sd p = 0.2009 |
| Median (Q1-Q3) | 76 | (68-87) | 76 | (68-91) | 75 | (67-85) | ||
| Min-Max | 48 | 119 | 52 | 119 | 48 | 108 | ||
| 95% CI | 75.39 | 79.85 | 75.68 | 82.42 | 73.21 | 79.1 | ||
| Respiratory Rate at t0 (RR_T0) | Mean ±SD | 17.59 | ±4.46 | 17.07 | ±4.57 | 18.09 | ±4.33 | Sd p = 0.1680 |
| Median (Q1-Q3) | 17 | (15-20) | 16 | (15-20) | 18 | (15-20) | ||
| Min-Max | 10 | 40 | 10 | 40 | 11 | 32 | ||
| 95% CI | 16.86 | 18.33 | 15.99 | 18.15 | 17.09 | 19.1 | ||
| Oxygen saturation at t0 (SPO2_T0) | Mean ±SD | 98.23 | ±1.79 | 98.14 | ±1.87 | 98.33 | ±1.7 | Sd p = 0.5155 |
| Median (Q1-Q3) | 99 | (97-100) | 99 | (97-100) | 99 | (97-100) | ||
| Min-Max | 92 | 100 | 92 | 100 | 92 | 100 | ||
| 95% CI | 97.95 | 98.52 | 97.72 | 98.56 | 97.94 | 98.72 | ||
| Diastolic blood pressure at t0 (DIASTOLIC_AP_T0) | Mean ±SD | 79.53 | ±11.64 | 80.1 | ±11.52 | 78.95 | ±11.82 | Sd p = 0.5399 |
| Median (Q1-Q3) | 80 | (72-87) | 80.5 | (73-87) | 80 | (70-87) | ||
| Min-Max | 51 | 106 | 51 | 106 | 51 | 105 | ||
| 95% CI | 77.68 | 81.39 | 77.51 | 82.7 | 76.25 | 81.65 | ||
| Numerical pain rating scale at t0 (NRS_T0) | Mean ±SD | 7.75 | ±1.21 | 7.7 | ±1.16 | 7.82 | ±1.26 | Sd p = 0.5395 |
| Median (Q1-Q3) | 8 | (7-8) | 8 | (7-8) | 8 | (7-9) | ||
| Min-Max | 6 | 10 | 6 | 10 | 6 | 10 | ||
| 95% CI | 7.56 | 7.95 | 7.44 | 7.96 | 7.53 | 8.1 | ||
| Rescue analgesic administered after t30 (RESCUE_ANALGESIC) | Yes | 37 | 23.9 | 18 | 22.8 | 19 | 25 | K2 p = 0.7464 |
| No | 118 | 76.1 | 61 | 77.2 | 57 | 75 | ||
| Total | 155 | 100 | 79 | 51 | 76 | 49 | ||
| Centre of inclusion (CENTRE2) | Albertville | 6 | 3.9 | 3 | 3.8 | 3 | 3.9 | |
| Annecy | 19 | 12.3 | 10 | 12.7 | 9 | 11.8 | ||
| Chambery | 8 | 5.2 | 4 | 5.1 | 4 | 5.3 | ||
| Grenoble (north site) | 95 | 61.3 | 49 | 62 | 46 | 60.5 | ||
| Grenoble (south site) | 4 | 2.6 | 2 | 2.5 | 2 | 2.6 | ||
| Saint-Jean-de-Maurienne | 22 | 14.2 | 11 | 13.9 | 11 | 14.5 | ||
| Voiron | 1 | 0.6 | 0 | 0 | 1 | 1.3 | ||
| Total | 155 | 100 | 79 | 51 | 76 | 49 | ||
| K2 : Khi2, Sd : Student | ||||||||
| Table 9 : Results in intention to treat population – Baseline characteristics of the participants – Cross sort |
| # Heart rate at t0 (HR_T0) : 1 unavailable data, 1 individual whose the “Randomisation group (GROUP)” item is filled “Intravenous morphine” |
| # Respiratory Rate at t0 (RR_T0) : 10 unavailable data, 2 individuals whose the “Randomisation group (GROUP)” item is filled “Intranasal Sufentanil” and 8 individuals whose the “Randomisation group (GROUP)” item is filled “Intravenous morphine” |
| # Oxygen saturation at t0 (SPO2_T0) : 1 unavailable data, 1 individual whose the “Randomisation group (GROUP)” item is filled “Intravenous morphine” |
| # Diastolic blood pressure at t0 (DIASTOLIC_AP_T0) : 1 unavailable data, 1 individual whose the “Randomisation group (GROUP)” item is filled “Intravenous morphine” |
| 3.2. Results between groups at baseline and at 30 minutes |
| [Top of page] |
| As described in the table below, the mean NRS drops from 7.7 at the first administration to 3.38 at 30 minutes in the IVM group and from 7.82 to 2.72 in the INS group. |
| Time according to Randomisation group | |||||
|---|---|---|---|---|---|
| Intravenous morphine, At Baseline | Intravenous morphine, At 30 minutes | Intranasal Sufentanil, At Baseline | Intranasal Sufentanil, At 30 minutes | ||
| N=79 | N=79 | N=76 | N=76 | ||
| Variable | Mean±SD
Med(Q1Q3) Min-Max 95%CI | Mean±SD
Med(Q1Q3) Min-Max 95%CI | Mean±SD
Med(Q1Q3) Min-Max 95%CI | Mean±SD
Med(Q1Q3) Min-Max 95%CI | |
| Numerical pain rating scale (NRS) | Mean ±SD | 7.7±1.16 | 3.38±1.93 | 7.82±1.26 | 2.72±2.18 |
| Median (Q1-Q3) | 8(7-8) | 3(2-4) | 8(7-9) | 2(1-4) | |
| Min-Max | 6-10 | 0-9 | 6-10 | 0-9 | |
| 95% CI | 7.44-7.96 | 2.94-3.82 | 7.53-8.1 | 2.22-3.22 | |
| Table 10 : Results in intention to treat population – Results between groups at baseline and at 30 minutes – Cross sort |
| # Numerical pain rating scale (NRS) : 4 unavailable data, 1 individual whose the “Time according to Randomisation group (ORD_GROUP_COD_TIME)” item is filled “Intranasal Sufentanil, At 30 minutes” and 3 individuals whose the “Time according to Randomisation group (ORD_GROUP_COD_TIME)” item is filled “Intravenous morphine, At 30 minutes” |
| 3.3. Analysis of NRS reduction between groups |
| [Top of page] |
| Non-inferiority is met, as the lower 97.5% confidence interval of 0.014 is greater than the prespecified non-inferiority margin of -1.3 (mean difference of NRS variation between groups: 0.817, 97.5% CI 0.014 to 1.621). |
| NRS difference between first administration and at 30 minutes (NRS2) | |||
|---|---|---|---|
| N=151 | |||
| Variable | MD*[97.5%CI] | ||
| Randomisation group (GROUP) | Intravenous morphine | 0 | n=151 |
| Intranasal Sufentanil | 0.817[ 0.014 ; 1.621] | ||
| *MD : Mean Difference | |||
| Table 11 : Results in intention to treat population – Analysis of NRS reduction between groups – Association strengths in univariate analyzes |
| 3.4. Analysis of NRS with univariate linear mixed models |
| [Top of page] |
| A significant effect of treatment is observed on NRS according to time in the univariate linear mixed model (p < 0.0001). |
| Numerical pain rating scale (NRS) | |||
|---|---|---|---|
| N=614 | |||
| Variable | MD*[95%CI] | p | |
| Time (ORD_COD_TIME) | At Baseline | 0 | Wd p < 0.0001
n=614 |
| At 10 minutes | -2.381[-2.673 ; -2.088] | ||
| At 20 minutes | -3.846[-4.183 ; -3.510] | ||
| At 30 minutes | -4.702[-5.053 ; -4.351] | ||
| Time according to Randomisation group (ORD_GROUP_COD_TIME) | Intravenous morphine, At Baseline | 0 | Wd p < 0.0001
n=614 |
| Intravenous morphine, At 10 minutes | -2.658[-3.083 ; -2.233] | ||
| Intravenous morphine, At 20 minutes | -3.683[-4.151 ; -3.215] | ||
| Intravenous morphine, At 30 minutes | -4.315[-4.774 ; -3.856] | ||
| Intranasal Sufentanil, At Baseline | 0.120[-0.260 ; 0.499] | ||
| Intranasal Sufentanil, At 10 minutes | -1.973[-2.490 ; -1.455] | ||
| Intranasal Sufentanil, At 20 minutes | -3.894[-4.441 ; -3.346] | ||
| Intranasal Sufentanil, At 30 minutes | -4.976[-5.528 ; -4.425] | ||
| Wd : Wald *MD : Mean Difference | |||
| Table 12 : Results in intention to treat population – Analysis of NRS with univariate linear mixed models – Association strengths in univariate analyzes |
| 3.5. Analysis of NRS with multivariate linear mixed model |
| [Top of page] |
| In the multivariate linear mixed model :
– A significant decrease in NRS is observed according to time (p < 0.0001). – An association is observed between treatment and NRS at 10 minutes (MD 0.686, 95% CI 0.068 to 1.304) and at 30 minutes (MD -0.662, 95% CI -1.313 to -0.010). |
| Numerical pain rating scale (NRS) | |||
|---|---|---|---|
| N=614 | n=614 | ||
| Variable | MD*[95%CI] | Wd p | |
| Randomisation group (GROUP) | Intravenous morphine | 0 | 0.9462 |
| Intranasal Sufentanil | 0.120[-0.260 ; 0.499] | ||
| Time (ORD_COD_TIME) | At Baseline | 0 | < 0.0001 |
| At 10 minutes | -2.658[-3.083 ; -2.233] | ||
| At 20 minutes | -3.683[-4.151 ; -3.215] | ||
| At 30 minutes | -4.315[-4.774 ; -3.856] | ||
| Wd : Wald *MD : Mean Difference | |||
| Table 13 : Results in intention to treat population – Analysis of NRS with multivariate linear mixed model – Association strengths in multivariate analysis |
| Description | MD*[IC95%] |
|---|---|
| GROUP Intranasal Sufentanil vs Intravenous morphine in ORD_COD_TIME At 10 minutes | 0.686[ 0.068 ; 1.304] |
| GROUP Intranasal Sufentanil vs Intravenous morphine in ORD_COD_TIME At 20 minutes | -0.210[-0.885 ; 0.464] |
| GROUP Intranasal Sufentanil vs Intravenous morphine in ORD_COD_TIME At 30 minutes | -0.662[-1.313 ; -0.010] |
| GROUP Intranasal Sufentanil vs Intravenous morphine in ORD_COD_TIME At Baseline | 0.120[-0.260 ; 0.499] |
| Table 14 : Results in intention to treat population – Analysis of NRS with multivariate linear mixed model – Description of association strengths in multivariate analysis |
| 3.6. Adverse events observed |
| [Top of page] |
| There are no statistically significant differences between groups in recorded mild or serious adverse events. |
| Randomisation group | ||||||
|---|---|---|---|---|---|---|
| Intravenous morphine | Intranasal Sufentanil | |||||
| N=79 | N=76 | Statistic | ||||
| Variable | n | %col | n | %col | p | |
| An SpO2 <90% is observed (HYPOXEMIA) | Yes | 1 | 1.3 | 4 | 5.3 | Fs p = 0.2038 |
| A systolic blood pressure <90 mmHg is observed (HYPOTENSION) | Yes | 1 | 1.3 | 2 | 2.6 | Fs p = 0.6153 |
| A Respiratory rate <10/minute is observed (BRADYPNEA) | Yes | 0 | 0 | 2 | 2.6 | Fs p = 0.2388 |
| An anaphylactic_shock is observed (ANAPHYLACTIC_SHOCK) | No | 79 | 100 | 76 | 100 | |
| A Ramsay score >2 is observed (COMA) | No | 79 | 100 | 76 | 100 | |
| A heart rate bpm <45/min is observed (BRADYCARDIA) | Yes | 0 | 0 | 1 | 1.3 | Fs p = 0.4903 |
| Patient required antidotal (naloxone) use (NAXOLONE) | No | 78 | 100 | 76 | 100 | |
| Dizziness is observed or declared (DIZZINESS) | Yes | 28 | 35.4 | 21 | 27.6 | K2 p = 0.2957 |
| Hot_flushes are declared (HOT_FLUSHES) | Yes | 22 | 27.8 | 14 | 18.4 | K2 p = 0.1647 |
| Nausea is observed or declared (NAUSEA) | Yes | 15 | 19 | 10 | 13.2 | K2 p = 0.3239 |
| Bad_taste is declared (BAD_TASTE) | Yes | 3 | 3.8 | 2 | 2.6 | Fs p = 1.0000 |
| Allergy is observed (ALLERGY) | Yes | 1 | 1.3 | 1 | 1.3 | Fs p = 1.0000 |
| Epistaxis is observed or declared (EPISTAXIS) | Yes | 1 | 1.3 | 0 | 0 | Fs p = 1.0000 |
| Hallucinations is observed or declared (HALLUCINATIONS) | No | 79 | 100 | 76 | 100 | |
| K2 : Khi2, Fs : Fisher | ||||||
| Table 15 : Results in intention to treat population – Adverse events observed – Cross sort |
| # Patient required antidotal (naloxone) use (NAXOLONE) : 1 unavailable data, 1 individual whose the “Randomisation group (GROUP)” item is filled “Intravenous morphine” |
| Tables and figures |
| Table 1 : Encodings |
| Table 2 : Results in per protocol population – Baseline characteristics of the participants – Cross sort |
| Table 3 : Results in per protocol population – Results between groups at baseline and at 30 minutes – Cross sort |
| Table 4 : Results in per protocol population – Analysis of NRS reduction between groups – Association strengths in univariate analyzes |
| Table 5 : Results in per protocol population – Analysis of NRS with univariate linear mixed models – Association strengths in univariate analyzes |
| Table 6 : Results in per protocol population – Analysis of NRS with multivariate linear mixed model – Association strengths in multivariate analysis |
| Table 7 : Results in per protocol population – Analysis of NRS with multivariate linear mixed model – Description of association strengths in multivariate analysis |
| Table 8 : Results in per protocol population – Adverse events observed – Cross sort |
| Table 9 : Results in intention to treat population – Baseline characteristics of the participants – Cross sort |
| Table 10 : Results in intention to treat population – Results between groups at baseline and at 30 minutes – Cross sort |
| Table 11 : Results in intention to treat population – Analysis of NRS reduction between groups – Association strengths in univariate analyzes |
| Table 12 : Results in intention to treat population – Analysis of NRS with univariate linear mixed models – Association strengths in univariate analyzes |
| Table 13 : Results in intention to treat population – Analysis of NRS with multivariate linear mixed model – Association strengths in multivariate analysis |
| Table 14 : Results in intention to treat population – Analysis of NRS with multivariate linear mixed model – Description of association strengths in multivariate analysis |
| Table 15 : Results in intention to treat population – Adverse events observed – Cross sort |
| Figure 1 : Study profile – Flowchart – Flowchart |
| Figure 2 : Results in per protocol population – NRS at the different time points by group – Graphics |
| Date of completion : 16 June 2021 |
| Implementer : RUS |
| Software version 0.1 |