| [2012-005370-62] Anti-interleukin-1 treatment in patients with rheumatoid arthritis and type 2 diabetes: A multicentre open-label randomised controlled trial.
Ruscitti P, Masedu F, Alvaro S, Airò P, Battafarano N, Cantarini L, et al. Source : PLOS ONE | https://doi.org/10.1371/journal.pmed.1002901 Download “Table 2012-005370-62-track” 2012-005370-62-track.zip – Downloaded 2 times – 1.22 MB Copyright : Unrestricted use of report data provided the original author and source are credited (raw royalty-free data). |
| Summary |
| Methods |
| Objective:
Aim of the study is to evaluate whether interleukin-1 (IL-1) inhibition with anakinra, a recombinant human IL-1 receptor antagonist, can improve both glycaemic and inflammatory parameters in participants with rheumatoid arthritis (RA) and type 2 diabetes (T2D) compared with tumour necrosis factor inhibitors (TNFis). Assessment: The study is a multicentre, open-label, randomised controlled trial performed in 12 Italian rheumatologic units between June 2013 and March 2016. In this study, 41 participants with RA and T2D were randomised, and 39 eligible participants were treated with Anakinra or TNFis. The primary outcome is the change in percentage of glycated haemoglobin (A1c) between baseline and subsequent visits (after 3 months and 6 months of follow-up). Secondary outcomes are DAS28 in assessing RA features and Fasting plasma glucose (FPG) in assessing T2D parameters. Study principles: The statistical analysis provided descriptive statistics and linear mixed models for the primary and secondary end points. Qualitative variables are described with frequencies and level percentages (Column percentages here). Quantitative variables are described with means and standard deviations, quartiles. |
| Warning, at least one selection of observation(s) was made on the initial database. |
| Codings and variables generated following the freeze of the database | |
|---|---|
| Original variable(s) | Created variable |
| A1c T0 (A1C_T0) | |
| A1c T3 (A1C_T3) | |
| A1c T6 (A1C_T6) | A1C (A1C) resulting from a listing (of A1C_T0 A1C_T3 A1C_T6) |
| BMI T0 (BMI_T0) | |
| BMI T3 (BMI_T3) | |
| BMI T6 (BMI_T6) | BMI (BMI) resulting from a listing (of BMI_T0 BMI_T3 BMI_T6) |
| DAS28 T0 (DAS28_T0) | |
| DAS28 T3 (DAS28_T3) | |
| DAS28 T6 (DAS28_T6) | DAS28 (DAS28) resulting from a listing (of DAS28_T0 DAS28_T3 DAS28_T6) |
| FPG mg/dL T0 (FPG_T0) | |
| FPG mg/dL T3 (FPG_T3) | |
| FPG mg/dL T6 (FPG_T6) | FPG (FPG) resulting from a listing (of FPG_T0 FPG_T3 FPG_T6) |
| REPETITIONS | |
| Study Drug (STUDY_DRUG) :
– Anakinra – TNFi | Visit according to Study Drug (STUDY_DRUG2_VISIT2) resulting from a crossing (with STUDY_DRUG2 VISIT2) :
– 1 : Anakinra, T0 – 2 : Anakinra, T3 – 3 : Anakinra, T6 – 4 : TNFi, T0 – 5 : TNFi, T3 – 6 : TNFi, T6 |
| REPETITIONS | Visit (VISIT) resulting from a conditioning (on REPETITIONS) :
– T0 – T3 – T6 |
| Table 1 : Encodings |
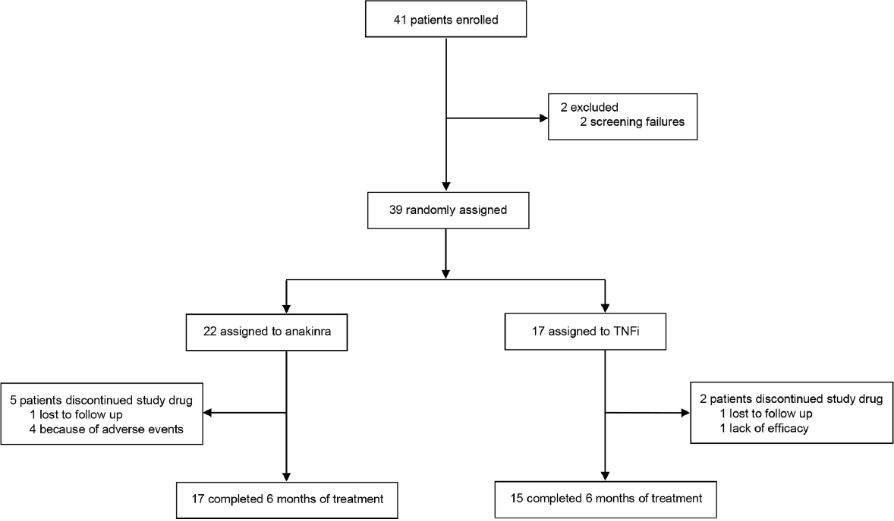
| 1. Study profile |
| 1.1. Flowchart |
| [Top of page] |
| Flowchart |
| A total of 39 participants were randomly assigned to the study groups: 22 to anakinra, 17 to TNFi. |
| 2. Results |
| 2.1. Baseline Characteristics of the Study Patients |
| [Top of page] |
| Participants had an average age of 62.72 ± 9.97 years, 74.4% were female.
The majority had seropositive RA disease (rheumatoid factor [RF]: 56.4% and/or anticyclic citrullinated peptide antibody [ACPA]: 61.5%) with active disease (Disease Activity Score-28 [DAS28]: 5.55 ± 1.03). All participants had T2D (A1c: 7.77 ± 0.7, fasting plasma glucose [FPG]: 139.13 ± 42.17 mg). |
| Population | Study Drug (STUDY_DRUG) | ||||||
|---|---|---|---|---|---|---|---|
| _ | Anakinra | TNFi | |||||
| N=39 | N=22 | N=17 | |||||
| Mean±SD
Med(Q1Q3) or | Mean±SD
Med(Q1Q3) or | Mean±SD
Med(Q1Q3) or | |||||
| Variable | n | %col | n | %col | n | %col | |
| Age (AGE) | Mean ±SD | 62.72 | ±9.97 | 62.86 | ±9.7 | 62.53 | ±10.6 |
| Median (Q1-Q3) | 62 | (54-70) | 63 | (56-69) | 62 | (54-70) | |
| Sex (SEX) | Female | 29 | 74.4 | 17 | 77.3 | 12 | 70.6 |
| Male | 10 | 25.6 | 5 | 22.7 | 5 | 29.4 | |
| Total | 39 | 100 | 22 | 56.4 | 17 | 43.6 | |
| RF | Yes | 22 | 56.4 | 12 | 54.5 | 10 | 58.8 |
| No | 17 | 43.6 | 10 | 45.5 | 7 | 41.2 | |
| Total | 39 | 100 | 22 | 56.4 | 17 | 43.6 | |
| ACPA | Yes | 24 | 61.5 | 14 | 63.6 | 10 | 58.8 |
| No | 15 | 38.5 | 8 | 36.4 | 7 | 41.2 | |
| Total | 39 | 100 | 22 | 56.4 | 17 | 43.6 | |
| RA duration (years) (RA_DURATION) | Mean ±SD | 2.86 | ±2.67 | 2.8 | ±2.59 | 2.93 | ±2.83 |
| Median (Q1-Q3) | 2 | (0.6-5) | 2 | (0.8-5) | 1 | (0.6-5) | |
| DAS28 T0 (DAS28_T0) | Mean ±SD | 5.55 | ±1.03 | 5.43 | ±1.19 | 5.7 | ±0.8 |
| Median (Q1-Q3) | 5.83 | (4.68-6.27) | 5.48 | (4.5-6.27) | 5.98 | (4.9-6.14) | |
| SDAI T0 (SDAI_T0) | Mean ±SD | 35.37 | ±22.66 | 34.98 | ±25.18 | 35.86 | ±19.68 |
| Median (Q1-Q3) | 28.1 | (21.3-43.1) | 25.45 | (21-43.1) | 30 | (25-39.3) | |
| VAS PAIN T0 (VAS_PAIN_T0) | Mean ±SD | 67.77 | ±26.47 | 66.86 | ±29.46 | 68.94 | ±22.86 |
| Median (Q1-Q3) | 77 | (50-87) | 75 | (50-88) | 77 | (70-80) | |
| CCSs (CCSS) | Yes | 22 | 56.4 | 9 | 40.9 | 13 | 76.5 |
| No | 17 | 43.6 | 13 | 59.1 | 4 | 23.5 | |
| Total | 39 | 100 | 22 | 56.4 | 17 | 43.6 | |
| T2D duration (years) (T2D_DURATION) | Mean ±SD | 1.64 | ±1.89 | 1.02 | ±0.94 | 2.44 | ±2.47 |
| Median (Q1-Q3) | 1 | (0.6-2) | 0.75 | (0.6-1) | 2 | (0.8-3) | |
| C Peptide mg/dL (C_PEPTIDE) | Mean ±SD | 2.66 | ±1.34 | 2.92 | ±1.42 | 2.32 | ±1.19 |
| Median (Q1-Q3) | 2.3 | (1.9-3.2) | 2.5 | (2-3.7) | 2.1 | (1.9-2.5) | |
| A1c T0 (A1C_T0) | Mean ±SD | 7.77 | ±0.7 | 7.73 | ±0.67 | 7.83 | ±0.76 |
| Median (Q1-Q3) | 7.5 | (7.2-8.2) | 7.5 | (7.2-8.2) | 7.5 | (7.3-8.2) | |
| FPG mg/dL T0 (FPG_T0) | Mean ±SD | 139.13 | ±42.17 | 139.05 | ±50.09 | 139.25 | ±29.55 |
| Median (Q1-Q3) | 132 | (113-154) | 131 | (101-158) | 132 | (116-150.5) | |
| Albuminuria mg/L T0 (ALBUMINURIA_T0) | Mean ±SD | 9.33 | ±10.88 | 11.93 | ±12.14 | 5.98 | ±8.15 |
| Median (Q1-Q3) | 5.64 | (0-15) | 9.6 | (0-20.7) | 0.21 | (0-10) | |
| BMI T0 (BMI_T0) | Mean ±SD | 27.93 | ±4.04 | 27.59 | ±4.48 | 28.38 | ±3.47 |
| Median (Q1-Q3) | 27.7 | (25-30.86) | 27.65 | (24.7-30.86) | 28.7 | (25.97-29.9) | |
| Insulin therapy (INSULIN_THERAPY) | Yes | 10 | 25.6 | 4 | 18.2 | 6 | 35.3 |
| No | 29 | 74.4 | 18 | 81.8 | 11 | 64.7 | |
| Total | 39 | 100 | 22 | 56.4 | 17 | 43.6 | |
| Comorbidities (COMORBIDITIES) | Yes | 39 | 100 | 22 | 100 | 17 | 100 |
| Total | 39 | 100 | 22 | 56.4 | 17 | 43.6 | |
| Table 2 : Results – Baseline Characteristics of the Study Patients – Cross sort |
| # FPG mg/dL T0 (FPG_T0) : 1 unavailable data, 1 individual whose the “Study Drug (STUDY_DRUG)” item is filled “TNFi” |
| 2.2. Measures of glycaemic control and bodyweight |
| [Top of page] |
| A significant reduction of A1c is observed in anakinra-treated participants when compared with TNFi-treated participants after 3 and 6 months of treatment (p = 0.0038 & p = 0.0004). The result is similar for FPG (p = 0.0362 & p = 0.0012). |
| Population | Study Drug (STUDY_DRUG) | ||||
|---|---|---|---|---|---|
| _ | Anakinra | TNFi | |||
| N=39 | N=22 | N=17 | Statistic | ||
| Variable | Mean±SD
Med(Q1Q3) | Mean±SD
Med(Q1Q3) | Mean±SD
Med(Q1Q3) | p | |
| A1c T3 (A1C_T3) | Mean ±SD | 7.27±0.72 | 6.95±0.61 | 7.64±0.68 | Sd p = 0.0038 |
| Median (Q1-Q3) | 7.2(6.8-7.8) | 6.8(6.7-7.5) | 7.35(7.2-8) | ||
| A1c T6 (A1C_T6) | Mean ±SD | 7.14±0.81 | 6.71±0.67 | 7.64±0.66 | Sd p = 0.0004 |
| Median (Q1-Q3) | 7.2(6.45-7.8) | 6.5(6.3-7.2) | 7.5(7.2-8.1) | ||
| FPG mg/dL T3 (FPG_T3) | Mean ±SD | 121.29±30.86 | 111.37±30.52 | 133.06±27.72 | Sd p = 0.0362 |
| Median (Q1-Q3) | 115(100-140) | 100(92-138) | 122.5(114-148.5) | ||
| FPG mg/dL T6 (FPG_T6) | Mean ±SD | 118.97±34.86 | 99.59±11.88 | 140.93±39.45 | Sd p = 0.0012 |
| Median (Q1-Q3) | 103.5(100-135) | 101(92-102) | 135(108-156) | ||
| Sd : Student | |||||
| Table 3 : Results – Measures of glycaemic control and bodyweight – Cross sort |
| # A1c T3 (A1C_T3) : 5 unavailable data, 4 individuals whose the “Study Drug (STUDY_DRUG)” item is filled “Anakinra” and 1 individual whose the “Study Drug (STUDY_DRUG)” item is filled “TNFi” |
| # A1c T6 (A1C_T6) : 7 unavailable data, 5 individuals whose the “Study Drug (STUDY_DRUG)” item is filled “Anakinra” and 2 individuals whose the “Study Drug (STUDY_DRUG)” item is filled “TNFi” |
| # FPG mg/dL T3 (FPG_T3) : 4 unavailable data, 3 individuals whose the “Study Drug (STUDY_DRUG)” item is filled “Anakinra” and 1 individual whose the “Study Drug (STUDY_DRUG)” item is filled “TNFi” |
| # FPG mg/dL T6 (FPG_T6) : 7 unavailable data, 5 individuals whose the “Study Drug (STUDY_DRUG)” item is filled “Anakinra” and 2 individuals whose the “Study Drug (STUDY_DRUG)” item is filled “TNFi” |
| 2.3. Analysis of A1c as clinical response with unajusted linear mixed models |
| [Top of page] |
| A significant effect of treatment is observed on A1c according to visit in the nonadjusted linear mixed model (p = 0.0048). |
| A1C | |||
|---|---|---|---|
| N=105 | |||
| Variable | MD*[95%CI] | p | |
| Visit according to Study Drug (STUDY_DRUG2_VISIT2) | Anakinra, T0 | 0 | Wd p = 0.0048
n=105 |
| Anakinra, T3 | -0.782[-1.093 ; -0.471] | ||
| Anakinra, T6 | -1.026[-1.384 ; -0.668] | ||
| TNFi, T0 | 0.098[-0.345 ; 0.540] | ||
| TNFi, T3 | -0.094[-0.516 ; 0.328] | ||
| TNFi, T6 | -0.092[-0.513 ; 0.330] | ||
| Sex (SEX) | Female | 0 | Wd p = 0.8792
n=105 |
| Male | -0.037[-0.509 ; 0.435] | ||
| Age (AGE) | -0.002[-0.020 ; 0.017] | Wd p = 0.8664
n=105 | |
| RA duration (years) (RA_DURATION) | 0.063[-0.024 ; 0.149] | Wd p = 0.1565
n=105 | |
| CCSs (CCSS) | Yes | 0 | Wd p = 0.5595
n=105 |
| No | -0.124[-0.538 ; 0.289] | ||
| T2D duration (years) (T2D_DURATION) | 0.042[-0.026 ; 0.109] | Wd p = 0.1575
n=105 | |
| Oral antidiabetic drugs (ORAL_ANTIDIA_DRUGS) | Yes | 0 | Wd p = 0.0932
n=105 |
| No | 0.444[-0.043 ; 0.931] | ||
| ACPA | Yes | 0 | Wd p = 0.9068
n=105 |
| No | -0.025[-0.440 ; 0.390] | ||
| BMI | 0.022[-0.026 ; 0.069] | Wd p = 0.3767
n=105 | |
| Wd : Wald *MD : Mean Difference | |||
| Table 4 : Results – Analysis of A1c as clinical response with unajusted linear mixed models – Association strengths in univariate analyzes |
| 2.4. Analysis of A1c as clinical response with multivariate linear mixed model |
| [Top of page] |
| An association is observed between treatment and A1c in the multivariate linear mixed model after 3 months (MD 0.848, 95% CI 0.179 to 1.516) and 6 months (MD 1.085, 95% CI 0.472 to 1.699). |
| A1C | |||
|---|---|---|---|
| N=105 | n=105 | ||
| Variable | MD*[95%CI] | Wd p | |
| Study Drug (STUDY_DRUG) | Anakinra | 0 | 0.0608 |
| TNFi | 0.242[-0.416 ; 0.901] | ||
| Visit (VISIT) | T0 | 0 | < 0.0001 |
| T3 | -0.792[-1.064 ; -0.520] | ||
| T6 | -1.010[-1.333 ; -0.688] | ||
| Sex (SEX) | Female | 0 | 0.5275 |
| Male | -0.189[-0.756 ; 0.379] | ||
| Age (AGE) | -0.008[-0.028 ; 0.013] | 0.4829 | |
| RA duration (years) (RA_DURATION) | 0.078[-0.003 ; 0.159] | 0.0746 | |
| CCSs (CCSS) | Yes | 0 | 0.3284 |
| No | 0.289[-0.259 ; 0.837] | ||
| T2D duration (years) (T2D_DURATION) | -0.064[-0.205 ; 0.077] | 0.3832 | |
| Oral antidiabetic drugs (ORAL_ANTIDIA_DRUGS) | Yes | 0 | 0.2225 |
| No | 0.346[-0.190 ; 0.882] | ||
| ACPA | Yes | 0 | 0.7949 |
| No | 0.055[-0.362 ; 0.471] | ||
| BMI | -0.017[-0.073 ; 0.040] | 0.5794 | |
| Wd : Wald *MD : Mean Difference | |||
| Table 5 : Results – Analysis of A1c as clinical response with multivariate linear mixed model – Association strengths in multivariate analysis |
| Description | MD*[IC95%] |
|---|---|
| STUDY_DRUG TNFi vs Anakinra in VISIT T3 | 0.848[ 0.179 ; 1.516] |
| STUDY_DRUG TNFi vs Anakinra in VISIT T6 | 1.085[ 0.472 ; 1.699] |
| STUDY_DRUG TNFi vs Anakinra in VISIT T0 | 0.242[-0.416 ; 0.901] |
| Table 6 : Results – Analysis of A1c as clinical response with multivariate linear mixed model – Description of association strengths in multivariate analysis |
| 2.5. Analysis of FPG as clinical response with unajusted linear mixed models |
| [Top of page] |
| A significant effect of treatment is observed on FPG according to visit in the nonadjusted linear mixed model (p = 0.0025). |
| FPG | |||
|---|---|---|---|
| N=105 | |||
| Variable | MD*[95%CI] | p | |
| Visit according to Study Drug (STUDY_DRUG2_VISIT2) | Anakinra, T0 | 0 | Wd p = 0.0025
n=105 |
| Anakinra, T3 | -27.68[-48.74 ; -6.618] | ||
| Anakinra, T6 | -39.46[-61.07 ; -17.84] | ||
| TNFi, T0 | 0.205[-24.59 ; 24.998] | ||
| TNFi, T3 | -5.983[-30.30 ; 18.330] | ||
| TNFi, T6 | 1.888[-26.22 ; 29.999] | ||
| Sex (SEX) | Female | 0 | Wd p = 0.1778
n=105 |
| Male | 14.318[-5.295 ; 33.931] | ||
| Age (AGE) | 0.270[-0.324 ; 0.863] | Wd p = 0.3765
n=105 | |
| RA duration (years) (RA_DURATION) | 1.847[-1.250 ; 4.944] | Wd p = 0.2250
n=105 | |
| CCSs (CCSS) | Yes | 0 | Wd p = 0.7913
n=105 |
| No | -2.139[-17.93 ; 13.649] | ||
| T2D duration (years) (T2D_DURATION) | 0.017[-2.585 ; 2.618] | Wd p = 0.9900
n=105 | |
| Oral antidiabetic drugs (ORAL_ANTIDIA_DRUGS) | Yes | 0 | Wd p = 0.3155
n=105 |
| No | 8.946[-8.060 ; 25.952] | ||
| ACPA | Yes | 0 | Wd p = 0.7103
n=105 |
| No | -3.040[-19.03 ; 12.953] | ||
| BMI | 0.052[-2.319 ; 2.423] | Wd p = 0.9658
n=105 | |
| Wd : Wald *MD : Mean Difference | |||
| Table 7 : Results – Analysis of FPG as clinical response with unajusted linear mixed models – Association strengths in univariate analyzes |
| 2.6. Analysis of DAS28 as clinical response with unajusted linear mixed models |
| [Top of page] |
| A significant effect of treatment is observed on DAS28 according to visit in the nonadjusted linear mixed model (p < 0.0001). |
| DAS28 | |||
|---|---|---|---|
| N=106 | |||
| Variable | MD*[95%CI] | p | |
| Visit according to Study Drug (STUDY_DRUG2_VISIT2) | Anakinra, T0 | 0 | Wd p < 0.0001
n=106 |
| Anakinra, T3 | -2.474[-3.039 ; -1.908] | ||
| Anakinra, T6 | -2.648[-3.306 ; -1.989] | ||
| TNFi, T0 | 0.272[-0.337 ; 0.880] | ||
| TNFi, T3 | -1.487[-2.168 ; -0.806] | ||
| TNFi, T6 | -1.844[-2.703 ; -0.984] | ||
| Sex (SEX) | Female | 0 | Wd p = 0.2229
n=106 |
| Male | -0.499[-1.235 ; 0.237] | ||
| Age (AGE) | 0.016[-0.017 ; 0.048] | Wd p = 0.3603
n=106 | |
| RA duration (years) (RA_DURATION) | -0.036[-0.176 ; 0.103] | Wd p = 0.6094
n=106 | |
| CCSs (CCSS) | Yes | 0 | Wd p = 0.8896
n=106 |
| No | 0.048[-0.628 ; 0.723] | ||
| T2D duration (years) (T2D_DURATION) | 0.000[-0.190 ; 0.191] | Wd p = 0.9959
n=106 | |
| Oral antidiabetic drugs (ORAL_ANTIDIA_DRUGS) | Yes | 0 | Wd p = 0.0310
n=106 |
| No | 0.821[ 0.165 ; 1.476] | ||
| ACPA | Yes | 0 | Wd p = 0.1702
n=106 |
| No | -0.503[-1.193 ; 0.188] | ||
| BMI | 0.077[ 0.004 ; 0.149] | Wd p = 0.0903
n=106 | |
| Wd : Wald *MD : Mean Difference | |||
| Table 8 : Results – Analysis of DAS28 as clinical response with unajusted linear mixed models – Association strengths in univariate analyzes |
| Tables and figures |
| Table 1 : Encodings |
| Table 2 : Results – Baseline Characteristics of the Study Patients – Cross sort |
| Table 3 : Results – Measures of glycaemic control and bodyweight – Cross sort |
| Table 4 : Results – Analysis of A1c as clinical response with unajusted linear mixed models – Association strengths in univariate analyzes |
| Table 5 : Results – Analysis of A1c as clinical response with multivariate linear mixed model – Association strengths in multivariate analysis |
| Table 6 : Results – Analysis of A1c as clinical response with multivariate linear mixed model – Description of association strengths in multivariate analysis |
| Table 7 : Results – Analysis of FPG as clinical response with unajusted linear mixed models – Association strengths in univariate analyzes |
| Table 8 : Results – Analysis of DAS28 as clinical response with unajusted linear mixed models – Association strengths in univariate analyzes |
| Figure 1 : Study profile – Flowchart – Flowchart |
| Date of completion : 9 June 2021 |
| Implementer : RUS |
| Software version 0.1 |