| [2011-001883-23] Does the provision of a DVD-based audiovisual presentation improve recruitment in a clinical trial? A randomised trial of DVD trial invitations.
Amy Rogers, Robert W. V. Flynn, Isla S. Mackenzie and Thomas M. MacDonald. Source : PLOS ONE | https://doi.org/10.1186/s12874-019-0663-6 Download “Table 2011-001883-23-fast” 2011-001883-23-fast.zip – Downloaded 2 times – 1.04 MB Copyright : Unrestricted use of report data provided the original author and source are credited (raw royalty-free data). |
| Summary |
| Methods |
| Objective:
Aim of the study is to ascertain whether sending an audio-visual presentation on a digital versatile disc (DVD), along with usual study invitation materials, improves recruitment to a clinical trial. Assessment: Potential participants for the Febuxostat versus Allopurinol Streamlined Trial (FAST) were identified by searches of GP records in Scottish primary care practices between August 2013 and July 2014 for this randomised parallel group study. One thousand fifty potential participants with established gout were invited, 509 individuals were randomised to receive the DVD presentation and the standard invitation and 541 received a standard invitation only. The primary endpoint is positive response to invitation. Secondary outcomes include any response to invitation, attendance for screening, and eventual randomisation. Study principles: Qualitative variables are described with frequencies and level percentages. Quantitative variables are described with means and standard deviations, quartiles, minimum/maximum, 95% confidence intervals. The association between a quantitative parameter and « Dvd (DVD) » item was evaluated with the Student(Sd) test. The association between a qualitative parameter and « Dvd (DVD) » item was evaluated with the Khi2(K2) test. The analyzes were carried out using logistic regressions. |
| Warning, at least one selection of observation(s) was made on the initial database. |
| Codings and variables generated following the freeze of the database | |
|---|---|
| Original variable(s) | Created variable |
| Age (AGE) :
– 59 – 60 – 61 – 62 – 63 – 64 – 65 – 66 – 67 – 68 – 69 – 70 – 70.91440081 – 71 – 72 – 73 – 74 – 75 – 76 – 77 – 78 – 79 – 80 – 81 – 82 – 83 – 84 – 85 – 86 – 87 – 88 – 89 – 90 – 91 – 93 | Age (NUM_AGE) resulting from a scan |
| SIMDmedian (SIMDMEDIAN) :
– 1 – 10 – 11 – 12 – 13 – 14 – 14.5 – 15 – 16 – 17 – 18 – 19 – 2 – 20 – 3 – 4 – 5 – 6 – 7 – 8 – 9 | SIMD quartile (NUM_SIMDMEDIAN3) resulting from a discretisation :
– 1 : [1 ; 9[ – 2 : [9 ; 13[ – 3 : [13 ; 16[ – 4 : [16 ; 20] |
| Randomised (RANDOMISED) :
– 0 : No – 1 : Yes | |
| SIMDmedian (SIMDMEDIAN) :
– 1 – 10 – 11 – 12 – 13 – 14 – 14.5 – 15 – 16 – 17 – 18 – 19 – 2 – 20 – 3 – 4 – 5 – 6 – 7 – 8 – 9 | SIMD quartile (SIMDMEDIAN3) resulting from a discretisation :
– 1 : [1 ; 10[ – 2 : [10 ; 14[ – 3 : [14 ; 16[ – 4 : [16 ; 20] |
| Table 1 : Encodings |
| 1. Study profile |
| 1.1. Flowchart |
| [Top of page] |
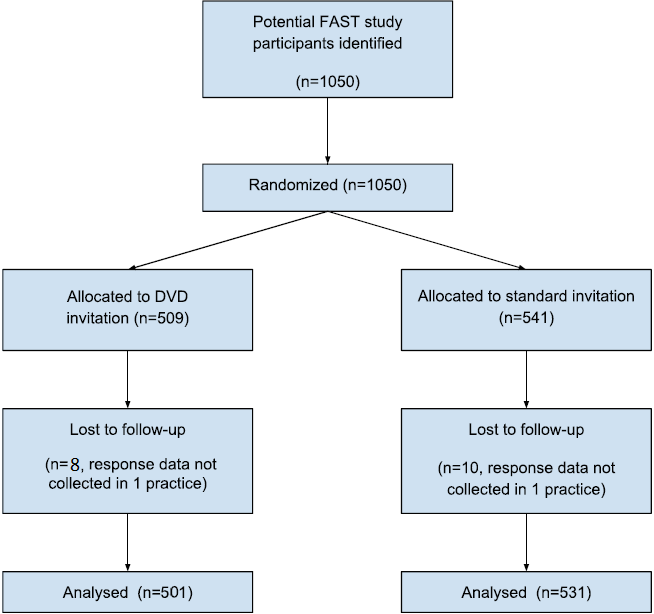
| Flowchart |
| A total of 1050 potential participants were identified and invited to take part in FAST.
As follow-up response data was not submitted for one practice, 18 individuals were removed from the analysis: The remaining 501 individuals who received the DVD and 531 who did not were included. |
| 2. Results |
| 2.1. Baseline characteristics of the sample |
| [Top of page] |
| Baseline characteristics are comparable between the groups. |
| Population | Dvd (DVD) | |||||||
|---|---|---|---|---|---|---|---|---|
| _ | No | Yes | ||||||
| N=1032 | N=531 | N=501 | ||||||
| Mean±SD
Med(Q1Q3) Min-Max 95%CI or | Mean±SD
Med(Q1Q3) Min-Max 95%CI or | Mean±SD
Med(Q1Q3) Min-Max 95%CI or | Statistic | |||||
| Variable | n | %col | n | %col | n | %col | p | |
| Age (NUM_AGE) | Mean ±SD | 70.93 | ±6.99 | 71 | ±6.99 | 70.84 | ±6.99 | Sd p = 0.7100 |
| Median (Q1-Q3) | 70.91 | (65-76) | 70.91 | (65-76) | 70.91 | (65-75) | ||
| Min-Max | 59 | 93 | 59 | 91 | 60 | 93 | ||
| 95% CI | 70.5 | 71.35 | 70.41 | 71.6 | 70.23 | 71.46 | ||
| Gender (GENDER) | Male | 828 | 80.2 | 425 | 80 | 403 | 80.4 | K2 p = 0.8714 |
| Female | 204 | 19.8 | 106 | 20 | 98 | 19.6 | ||
| Total | 1032 | 100 | 531 | 51.5 | 501 | 48.5 | ||
| SIMD quartile (NUM_SIMDMEDIAN3) | [1 ; 9[ | 263 | 25.5 | 138 | 26 | 125 | 25 | K2 p = 0.6565 |
| [9 ; 13[ | 269 | 26.1 | 134 | 25.2 | 135 | 26.9 | ||
| [13 ; 16[ | 226 | 21.9 | 111 | 20.9 | 115 | 23 | ||
| [16 ; 20] | 274 | 26.6 | 148 | 27.9 | 126 | 25.1 | ||
| Total | 1032 | 100 | 531 | 51.5 | 501 | 48.5 | ||
| K2 : Khi2, Sd : Student | ||||||||
| Table 2 : Results – Baseline characteristics of the sample – Cross sort |
| 2.2. Invitation outcomes |
| [Top of page] |
| Associations between group and response to invitation / positive response are highlighted (p = 0.0232 and p = 0.0459 respectively).
Indeed, DVD recipients are less likely to : – respond to invitation (OR 0.752, 95% CI 0.588 to 0.962). – respond positively (OR 0.764, 95% CI 0.586 to 0.995). |
| Population | Dvd (DVD) | |||||||||
|---|---|---|---|---|---|---|---|---|---|---|
| _ | No | Yes | ||||||||
| N=1032 | N=531 | N=501 | Statistic | Survival | ||||||
| Variable | n | %col | n | %row | n | %row | p | OR*[95%CI] | p | |
| Responded to the invitation (RESPONDED) | Yes | 579 | 56.1 | 316 | 54.6 | 263 | 45.4 | K2 p = 0.0232 | 1 | Wd p = 0.0233 |
| No | 453 | 43.9 | 215 | 47.5 | 238 | 52.5 | 1.330[1.039 ; 1.702] | |||
| Total | 1032 | 100 | 531 | 51.5 | 501 | 48.5 | ||||
| Positive response (YES) | Yes | 321 | 31.1 | 180 | 56.1 | 141 | 43.9 | K2 p = 0.0459 | 0.764[0.586 ; 0.995] | Wd p = 0.0462 |
| No | 711 | 68.9 | 351 | 49.4 | 360 | 50.6 | 1 | |||
| Total | 1032 | 100 | 531 | 51.5 | 501 | 48.5 | ||||
| Screened (SCREENED) | Yes | 293 | 28.4 | 153 | 52.2 | 140 | 47.8 | K2 p = 0.7569 | 0.958[0.731 ; 1.256] | Wd p = 0.7570 |
| No | 739 | 71.6 | 378 | 51.2 | 361 | 48.8 | 1 | |||
| Total | 1032 | 100 | 531 | 51.5 | 501 | 48.5 | ||||
| Randomised (RANDOMISED) | Yes | 264 | 25.6 | 137 | 51.9 | 127 | 48.1 | K2 p = 0.8682 | 0.977[0.738 ; 1.292] | Wd p = 0.8682 |
| No | 768 | 74.4 | 394 | 51.3 | 374 | 48.7 | 1 | |||
| Total | 1032 | 100 | 531 | 51.5 | 501 | 48.5 | ||||
| K2 : Khi2, Wd : Wald *OR : Odds Ratio | ||||||||||
| Table 3 : Results – Invitation outcomes – Cross sort |
| 2.3. Analyse of positive response with univariate models |
| [Top of page] |
| A significant effect of gender and Scottish Index of Multiple Deprivation (SIMD) is also observed on positive response in univariate logistic models (p = 0.0058 and p = 0.0166 respectively). |
| Positive response (YES) | |||
|---|---|---|---|
| N=1032 | |||
| Variable | OR*[95%CI] | p | |
| Dvd (DVD) | Yes | 0.764[0.586 ; 0.995] | Wd p = 0.0462
n=1032 |
| No | 1 | ||
| Age (NUM_AGE) | 0.989[0.970 ; 1.008] | Wd p = 0.2531
n=1032 | |
| Gender (GENDER) | Male | 1 | Wd p = 0.0058
n=1032 |
| Female | 0.605[0.424 ; 0.865] | ||
| SIMD quartile (NUM_SIMDMEDIAN3) | [1 ; 9[ | 0.687[0.473 ; 1.000] | Wd p = 0.0166
n=1032 |
| [9 ; 13[ | 0.806[0.560 ; 1.162] | ||
| [13 ; 16[ | 1.235[0.855 ; 1.785] | ||
| [16 ; 20] | 1 | ||
| Wd : Wald *OR : Odds Ratio | |||
| Table 4 : Results – Analyse of positive response with univariate models – Association strengths in univariate analyzes |
| 2.4. Analyse of positive response with multivariate model |
| [Top of page] |
| The results for the groups are confirmed after adjustment (adjusted OR 0.754, 95% CI 0.577 to 0.985).
Otherwise, females are less likely to respond positively than males (adjusted OR 0.619, 95% CI 0.429 to 0.892) and respondents from areas in SIMD 3rd quartile are more likely to wish to take part compared to others. |
| Positive response (YES) | |||
|---|---|---|---|
| N=1032 | n=1032 | ||
| Explanatory variables | OR*[95%CI] | Wd p | |
| Dvd (DVD) | Yes | 0.754[0.577 ; 0.985] | 0.0385 |
| No | 1 | ||
| Age (NUM_AGE) | 0.993[0.974 ; 1.013] | 0.5018 | |
| Gender (GENDER) | Male | 1 | 0.0102 |
| Female | 0.619[0.429 ; 0.892] | ||
| SIMD quartile (NUM_SIMDMEDIAN3) | [1 ; 9[ | 0.704[0.483 ; 1.025] | 0.0162 |
| [9 ; 13[ | 0.847[0.586 ; 1.224] | ||
| [13 ; 16[ | 1.293[0.892 ; 1.875] | ||
| [16 ; 20] | 1 | ||
| Wd : Wald *OR : Odds Ratio | |||
| Table 5 : Results – Analyse of positive response with multivariate model – Association strengths in multivariate analysis |
| 2.5. Characteristics of randomised participants with versus without DVD |
| [Top of page] |
| The DVD is not associated with any significant difference in the age, gender or deprivation of randomised participants. |
| Population | Dvd (DVD) | |||||||
|---|---|---|---|---|---|---|---|---|
| _ | No | Yes | ||||||
| N=264 | N=137 | N=127 | ||||||
| Mean±SD
Med(Q1Q3) Min-Max 95%CI or | Mean±SD
Med(Q1Q3) Min-Max 95%CI or | Mean±SD
Med(Q1Q3) Min-Max 95%CI or | Statistic | |||||
| Variable | n | %col | n | %col | n | %col | p | |
| Age (NUM_AGE) | Mean ±SD | 70.07 | ±6.09 | 70.41 | ±6.3 | 69.7 | ±5.87 | Sd p = 0.3465 |
| Median (Q1-Q3) | 70 | (66-74) | 70.91 | (66-75) | 69 | (66-73) | ||
| Min-Max | 60 | 87 | 60 | 86 | 60 | 87 | ||
| 95% CI | 69.33 | 70.81 | 69.35 | 71.47 | 68.67 | 70.73 | ||
| Gender (GENDER) | Male | 228 | 86.4 | 120 | 87.6 | 108 | 85 | K2 p = 0.5461 |
| Female | 36 | 13.6 | 17 | 12.4 | 19 | 15 | ||
| Total | 264 | 100 | 137 | 51.9 | 127 | 48.1 | ||
| SIMD quartile (SIMDMEDIAN3) | [1 ; 10[ | 59 | 22.3 | 31 | 22.6 | 28 | 22 | K2 p = 0.2364 |
| [10 ; 14[ | 57 | 21.6 | 23 | 16.8 | 34 | 26.8 | ||
| [14 ; 16[ | 71 | 26.9 | 41 | 29.9 | 30 | 23.6 | ||
| [16 ; 20] | 77 | 29.2 | 42 | 30.7 | 35 | 27.6 | ||
| Total | 264 | 100 | 137 | 51.9 | 127 | 48.1 | ||
| K2 : Khi2, Sd : Student | ||||||||
| Table 6 : Results – Characteristics of randomised participants with versus without DVD – Cross sort |
| Tables and figures |
| Table 1 : Encodings |
| Table 2 : Results – Baseline characteristics of the sample – Cross sort |
| Table 3 : Results – Invitation outcomes – Cross sort |
| Table 4 : Results – Analyse of positive response with univariate models – Association strengths in univariate analyzes |
| Table 5 : Results – Analyse of positive response with multivariate model – Association strengths in multivariate analysis |
| Table 6 : Results – Characteristics of randomised participants with versus without DVD – Cross sort |
| Figure 1 : Study profile – Flowchart – Flowchart |
| Date of completion : 20 June 2021 |
| Implementer : RUS |
| Software version 0.1 |