| [2011-000381-35] Using a Human Challenge Model of Infection to Measure Vaccine Efficacy : A Randomised controlled Trial Comparing the Typhoid Vaccines M01ZH09 with Placebo and Ty21a.
Darton TC, Jones C, Blohmke CJ, Waddington CS, Zhou L, Peters A, et al. Source : PLOS Neglected Tropical Diseases | https://doi.org/10.1371/journal.pntd.0004926 Download “Table 2011-000381-35-m01zh09” 2011-000381-35-m01zh09.zip – Downloaded 5 times – 4.50 MB Copyright : Unrestricted use of report data provided the original author and source are credited (raw royalty-free data). |
| Summary |
| Methods |
| Objective:
Aim of the study is to evaluate the protective efficacy of a single dose of M01ZH09, in susceptible volunteers by direct typhoid challenge. Assessment: A randomised, double-blind, placebo-controlled trial in healthy adult participants at a centre in Oxford (UK) was performed between November 2011 and June 2012. Ninety-nine participants were allocated to receive one dose of double-blinded M01ZH09 or placebo or 3-doses of open-label Ty21a. Twenty-eight days after vaccination, participants were challenged with E+4CFU S. Typhi Quailes strain. Primary outcome criteria is the percentage of participants reaching pre-defined endpoints constituting typhoid diagnosis (fever and/or bacteraemia) during the 14 days after challenge. Typhoid diagnosis (TD) was defined as either: – oral temperature >=38°C sustained for >=12 hours or more after day 5 of challenge, – a blood culture positive for S. Typhi taken after day 7 of challenge, – a blood culture positive for S. Typhi collected after day 5 plus objective symptoms or signs (including fever) of typhoid infection. Secondary outcomes are (i) fever >= 37.0°C, >=37.5°C, >=38.0°C, >=38.5°C (any duration), (ii) fever >=38°C then positive blood culture sampling, (iii) bacteraemia or stool culture positive. Study principles : Qualitative variables are described with frequencies and level percentages (Column percentages here). The association between a parameter and « Group (GROUP) » item was evaluated with Khi2(K2) tests or Fisher(Fs) exact tests when the conditions of validity were not respected. The survival curves were built on ‘status of infection’ (N=51), ‘status of first fever’ (N=51) and ‘status of first positive blood culture’ (N=91) items with Kaplan Meier method. The analyzes were carried out using Cox models. |
| Warning, at least one selection of observation(s) was made on the initial database. |
| Codings and variables generated following the freeze of the database | |
|---|---|
| Original variable(s) | Created variable |
| Bacteraemia or stool culture positive (POSBCORSTOOL) | |
| Disponibilité : Bacteraemia or stool culture positive (POSBCORSTOOL_ND) :
– 0 : Disponible – 1 : Non disponible – 2 : Non applicable – 3 : Non disponible – 4 : Non applicable | Bacteraemia or stool culture positive (POSBCORSTOOL2) resulting from a ordinalization :
– 0 : No – 1 : Yes |
| Disponibilité : Fever >=38°C then positive blood culture sampling (T38THENPOSBC_ND) :
– 0 : Disponible – 1 : Non disponible – 2 : Non applicable – 3 : Non disponible – 4 : Non applicable | |
| Fever >=38°C then positive blood culture sampling (T38THENPOSBC) | Fever >=38°C then positive blood culture sampling (T38THENPOSBC2) resulting from a ordinalization :
– 0 : No – 1 : Yes |
| Day of typhoid diagnosis (DAYTD) | |
| Disponibilité : Day of typhoid diagnosis (DAYTD_ND) :
– 0 : Disponible – 1 : Non disponible – 2 : Non applicable – 3 : Non disponible – 4 : Non applicable | Typhoïd diagnosis (TDSTATUT2) resulting from a ordinalization :
– 0 : No – 1 : Yes |
| >=37.0°C (T37) | |
| Disponibilité : >=37.0°C (T37_ND) :
– 0 : Disponible – 1 : Non disponible – 2 : Non applicable – 3 : Non disponible – 4 : Non applicable | >=37.0°C (TEMP37) resulting from a ordinalization :
– 0 : No – 1 : Yes |
| >=37.5°C (T37_5) | |
| Disponibilité : >=37.5°C (T37_5_ND) :
– 0 : Disponible – 1 : Non disponible – 2 : Non applicable – 3 : Non disponible – 4 : Non applicable | >=37.5°C (TEMP37_5) resulting from a ordinalization :
– 0 : No – 1 : Yes |
| >=38°C (T38) | |
| Disponibilité : >=38°C (T38_ND) :
– 0 : Disponible – 1 : Non disponible – 2 : Non applicable – 3 : Non disponible – 4 : Non applicable | >=38.0°C (TEMP38) resulting from a ordinalization :
– 0 : No – 1 : Yes |
| >=38.5°C (T38_5) | |
| Disponibilité : >=38.5°C (T38_5_ND) :
– 0 : Disponible – 1 : Non disponible – 2 : Non applicable – 3 : Non disponible – 4 : Non applicable | >=38.5°C (TEMP38_5) resulting from a ordinalization :
– 0 : No – 1 : Yes |
| Disponibilité : Time to first positive blood culture sampling, hours (TTPOSBC_ND) :
– 0 : Disponible – 1 : Non disponible – 2 : Non applicable – 3 : Non disponible – 4 : Non applicable | |
| Time to first positive blood culture sampling, hours (TTPOSBC) | Positive blood culture (TTPOSBCSTATUT2) resulting from a scan |
| Disponibilité : Time to first fever >=38°C, hours (TTT38_ND) :
– 0 : Disponible – 1 : Non disponible – 2 : Non applicable – 3 : Non disponible – 4 : Non applicable | |
| Time to first fever >=38°C, hours (TTT38) | Fever (TTT38STATUT2) resulting from a ordinalization :
– 0 : No – 1 : Yes |
| Table 1 : Encodings |
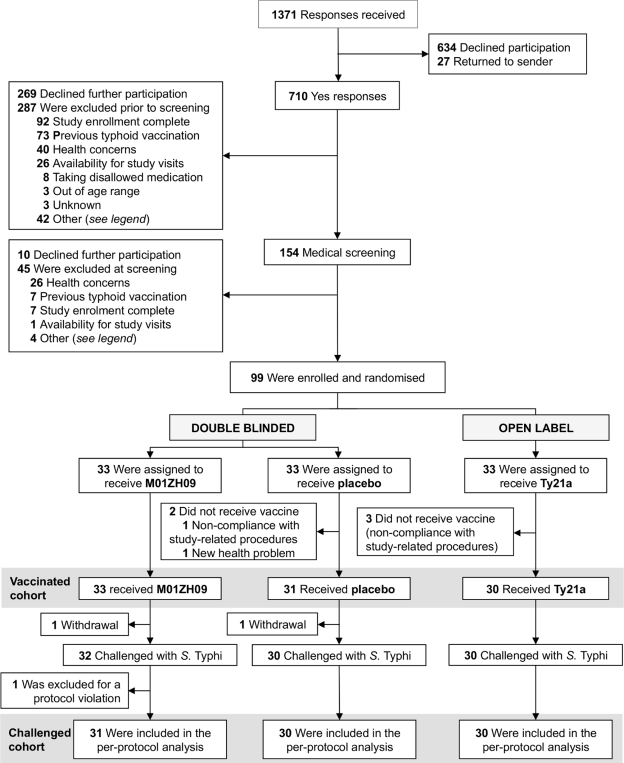
| 1. Study profile |
| 1.1. Flowchart |
| [Top of page] |
| Ninety-nine participants were enrolled and randomised to one of three vaccine groups, 91 constituted the per-protocol analysis. |
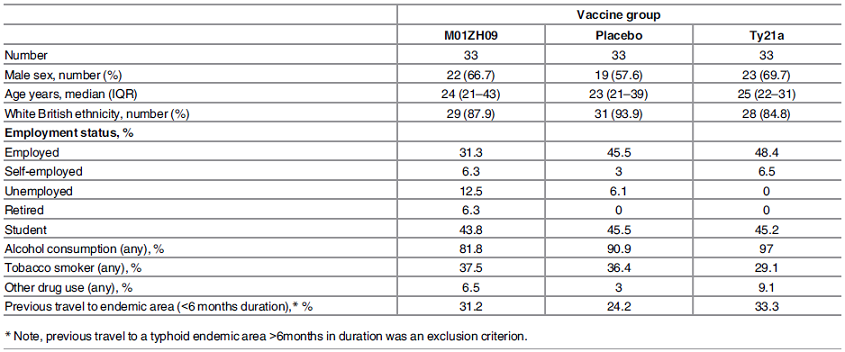
| 2. Study participants |
| 2.1. Participant characteristics by enrolled vaccine group |
| [Top of page] |
| The demographic characteristics of each group are similar. |
| 3. Results in per protocol population |
| 3.1. Summary of severity measures reached during the 14day challenge period |
| [Top of page] |
| Associations between group and fever >=37.0°C (p = 0.0406), fever >=38°C then positive blood culture sampling (p = 0.0270) and bacteraemia or stool culture positive (p = 0.0195) are highlighted. |
| Population | Group (GROUP) | |||||||||
|---|---|---|---|---|---|---|---|---|---|---|
| _ | M01ZH09 | Placebo | Ty21a | |||||||
| N=91 | N=31 | N=30 | N=30 | Statistic | ||||||
| Variable | n | %col | n | %col | n | %col | n | %col | p | |
| Typhoïd diagnosis (TDSTATUT2) | Yes | 51 | 56 | 18 | 58.1 | 20 | 66.7 | 13 | 43.3 | K2 p = 0.1833 |
| Total | 91 | 100 | 31 | 34.1 | 30 | 33 | 30 | 33 | ||
| >=37.0°C (TEMP37) | Yes | 74 | 81.3 | 27 | 87.1 | 27 | 90 | 20 | 66.7 | K2 p = 0.0406 |
| Total | 91 | 100 | 31 | 34.1 | 30 | 33 | 30 | 33 | ||
| >=37.5°C (TEMP37_5) | Yes | 47 | 51.6 | 16 | 51.6 | 20 | 66.7 | 11 | 36.7 | K2 p = 0.0670 |
| Total | 91 | 100 | 31 | 34.1 | 30 | 33 | 30 | 33 | ||
| >=38.0°C (TEMP38) | Yes | 39 | 42.9 | 14 | 45.2 | 16 | 53.3 | 9 | 30 | K2 p = 0.1794 |
| Total | 91 | 100 | 31 | 34.1 | 30 | 33 | 30 | 33 | ||
| >=38.5°C (TEMP38_5) | Yes | 25 | 27.5 | 9 | 29 | 10 | 33.3 | 6 | 20 | K2 p = 0.4976 |
| Total | 91 | 100 | 31 | 34.1 | 30 | 33 | 30 | 33 | ||
| Fever >=38°C then positive blood culture sampling (T38THENPOSBC2) | Yes | 17 | 18.7 | 5 | 16.1 | 10 | 33.3 | 2 | 6.7 | K2 p = 0.0270 |
| Total | 91 | 100 | 31 | 34.1 | 30 | 33 | 30 | 33 | ||
| Bacteraemia or stool culture positive (POSBCORSTOOL2) | Yes | 63 | 69.2 | 21 | 67.7 | 26 | 86.7 | 16 | 53.3 | K2 p = 0.0195 |
| Total | 91 | 100 | 31 | 34.1 | 30 | 33 | 30 | 33 | ||
| K2 : Khi2 | ||||||||||
| Table 2 : Results in per protocol population – Summary of severity measures reached during the 14day challenge period – Cross sort |
| 3.2. Analysis of typhoïd infection according to the group |
| [Top of page] |
| Based on analysis, M01ZH09 significantly reduces the instantaneous risk of Typhoïd diagnosis compared to placebo (HR 0.393, 95% CI 0.199 to 0.776). |
| Typhoïd diagnosis (TDSTATUT2) | |||
|---|---|---|---|
| N=51 | |||
| Variable | HR*[95%CI] | p | |
| Group (GROUP) | M01ZH09 | 0.393[0.199 ; 0.776] | Wd p = 0.0268
n=51 |
| Placebo | 1 | ||
| Ty21a | 0.644[0.313 ; 1.323] | ||
| Wd : Wald *HR : Hazard Ratio | |||
| Table 3 : Results in per protocol population – Analysis of typhoïd infection according to the group – Association strengths in univariate analyzes |
| 3.3. Incidence of typhoid infection at Time 0 |
| [Top of page] |
| Association between group and incidence of typhoid infection after Serovar Typhi challenge at Time 0 is highlighted (p = 0.0068). |
Kaplan Meier (p = 0.0068)
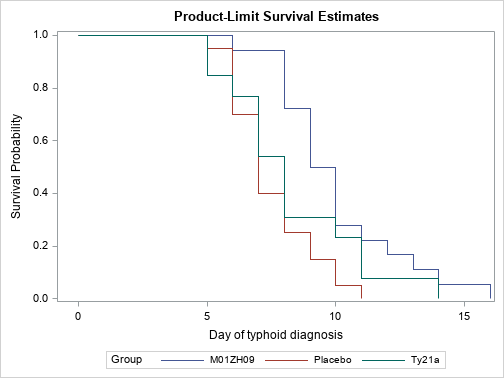 |
| Figure 3 : Results in per protocol population – Incidence of typhoid infection at Time 0 – Survival graphics |
| 3.4. Analysis of fever according to the group |
| [Top of page] |
| Based on analysis, M01ZH09 significantly reduces the instantaneous risk of fever compared to placebo (HR 0.362, 95% CI 0.183 to 0.715). |
| Fever (TTT38STATUT2) | |||
|---|---|---|---|
| N=51 | |||
| Variable | HR*[95%CI] | p | |
| Group (GROUP) | M01ZH09 | 0.362[0.183 ; 0.715] | Wd p = 0.0139
n=51 |
| Placebo | 1 | ||
| Ty21a | 0.620[0.300 ; 1.278] | ||
| Wd : Wald *HR : Hazard Ratio | |||
| Table 4 : Results in per protocol population – Analysis of fever according to the group – Association strengths in univariate analyzes |
| 3.5. Incidence of fever after Serovar Typhi challenge at Time 0 |
| [Top of page] |
| Association between group and incidence of fever at Time 0 is highlighted (p = 0.0106). |
Kaplan Meier (p = 0.0106)
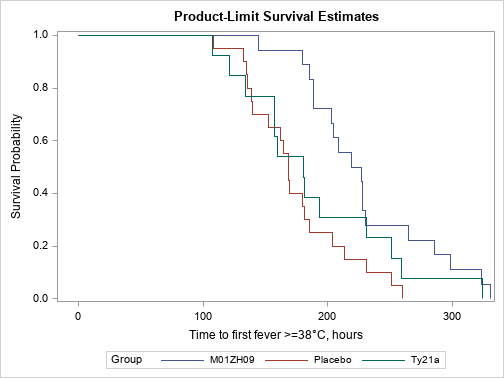 |
| Figure 4 : Results in per protocol population – Incidence of fever after Serovar Typhi challenge at Time 0 – Survival graphics |
| 3.6. Analysis of bacteraemia according to the group |
| [Top of page] |
| Based on analysis, M01ZH09 significantly reduces the instantaneous risk of positive blood culture compared to Ty21a (HR 0.465, 95% CI 0.271 to 0.802). |
| Positive blood culture (TTPOSBCSTATUT2) | |||
|---|---|---|---|
| N=91 | |||
| Variable | HR*[95%CI] | p | |
| Group (GROUP) | M01ZH09 | 1 | Wd p = 0.0218
n=91 |
| Placebo | 1.398[0.830 ; 2.356] | ||
| Ty21a | 2.147[1.247 ; 3.696] | ||
| Wd : Wald *HR : Hazard Ratio | |||
| Table 5 : Results in per protocol population – Analysis of bacteraemia according to the group – Association strengths in univariate analyzes |
| 3.7. Incidence of bacteraemia after Serovar Typhi challenge at Time 0 |
| [Top of page] |
| Association between group and incidence of bacteraemia at Time 0 is highlighted (p = 0.0037). |
Kaplan Meier (p = 0.0037)
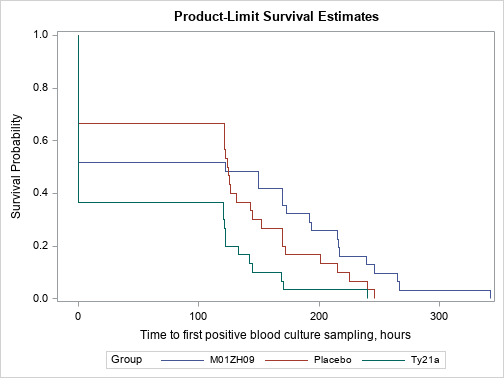 |
| Figure 5 : Results in per protocol population – Incidence of bacteraemia after Serovar Typhi challenge at Time 0 – Survival graphics |
| Tables and figures |
| Table 1 : Encodings |
| Table 2 : Results in per protocol population – Summary of severity measures reached during the 14day challenge period – Cross sort |
| Table 3 : Results in per protocol population – Analysis of typhoïd infection according to the group – Association strengths in univariate analyzes |
| Table 4 : Results in per protocol population – Analysis of fever according to the group – Association strengths in univariate analyzes |
| Table 5 : Results in per protocol population – Analysis of bacteraemia according to the group – Association strengths in univariate analyzes |
| Figure 1 : Study profile – Flowchart |
| Figure 2 : Study participants – Participant characteristics by enrolled vaccine group |
| Figure 3 : Results in per protocol population – Incidence of typhoid infection at Time 0 – Survival graphics |
| Figure 4 : Results in per protocol population – Incidence of fever after Serovar Typhi challenge at Time 0 – Survival graphics |
| Figure 5 : Results in per protocol population – Incidence of bacteraemia after Serovar Typhi challenge at Time 0 – Survival graphics |
| Date of completion : 23 June 2021 |
| Implementer : RUS |
| Software version 0.1 |