| [2010-019787-36] Oral Ondansetron versus Domperidone for Acute Gastroenteritis in Pediatric Emergency Departments: Multicenter Double Blind Randomized Controlled Trial.
Marchetti F, Bonati M, Maestro A, Zanon D, Rovere F, Arrighini A, et al. Source : PLOS ONE | https://doi.org/10.1371/journal.pone.0165441 Download “Table 2010-019787-36-sondo” 2010-019787-36-sondo.zip – Downloaded 3 times – 1.30 MB Copyright : Unrestricted use of report data provided the original author and source are credited (raw royalty-free data). |
| Summary |
| Methods |
| Objective:
Aim of the study is to evaluate whether a single oral dose of ondansetron vs domperidone or placebo improves outcomes in children with gastroenteritis. Assessment: A prospective, multicenter, double-blind randomized controlled trial involved children admitted to 15 pediatric emergency departments (EDs) in Italy was performed between July 7, 2011 (first randomization) and November 3, 2013 (last follow-up). In this study, 356 children were randomized to receive one oral dose of ondansetron (0.15 mg/kg) or domperidone (0.5 mg/kg) or placebo. The primary outcome is the percentage of children receiving nasogastric or intravenous rehydration after symptomatic oral treatment failure, defined as vomiting or fluid refusal after the second ORT attempt. Secondary outcomes are: – The percentage of subjects remaining in ED for observation stay for more than 6 hours; – The percentage of subjects requiring hospital admission during the ED stay; – Subjects with episodes of vomiting and number of episodes in the 3 treatment groups during the ED stay and during the 48-hour follow-up period; – The rate of success at the second ORT attempt and the percentage of subjects requiring laboratory tests during ED stay; – Subjects with episodes of diarrhea and the number of episodes in the 3 treatment groups were evaluated both during ED stay and during the 48-hour follow-up period; – The percentage of subjects presenting adverse events during ED stay and during the 48-hour follow-up period. Study principles: As the analysis is the second and final interim analysis of the study, the level of significance was set at 0.014 and the confidence intervals are 98.6%. Qualitative variables are described with frequencies and level percentages (Column percentages here). Quantitative variables are described with means and standard deviations, quartiles. The analyzes were carried out using logistic regressions. |
| 1. Study profile |
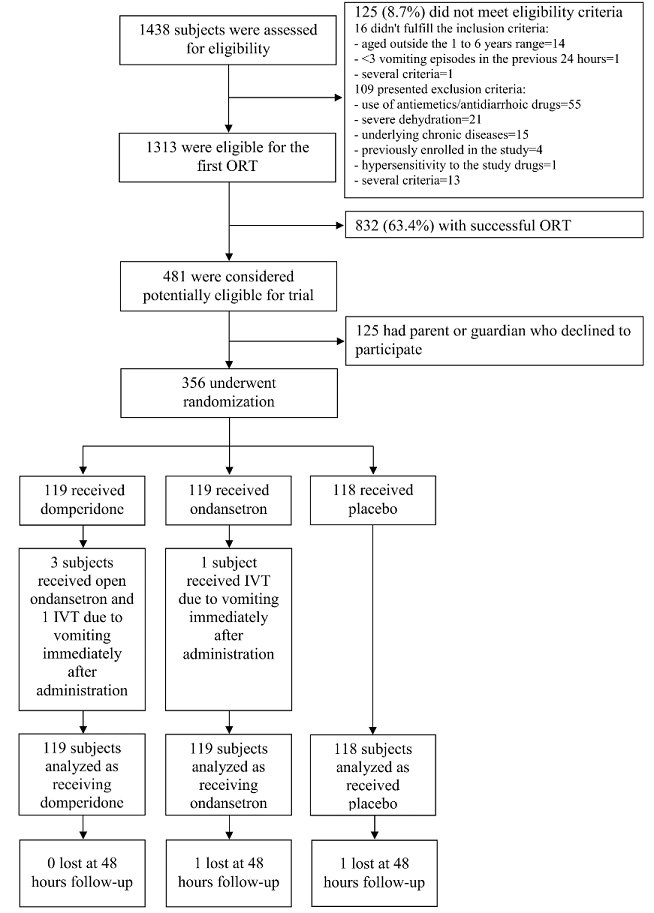
| 1.1. Flowchart |
| [Top of page] |
| Flowchart |
| A total of 356 children were randomly assigned to the study groups: 119 to domperidone, 119 to ondansetron and 118 to placebo. |
| 2. Results |
| 2.1. Baseline Characteristics of the Study Patients |
| [Top of page] |
| The basic characteristics of the children are similar between the randomization groups. |
| Population | Group ITT (V3) | ||||||||
|---|---|---|---|---|---|---|---|---|---|
| _ | domperidone | ondansetron | placebo | ||||||
| N=356 | N=119 | N=119 | N=118 | ||||||
| Mean±SD
Med(Q1Q3) or | Mean±SD
Med(Q1Q3) or | Mean±SD
Med(Q1Q3) or | Mean±SD
Med(Q1Q3) or | ||||||
| Variable | n | %col | n | %col | n | %col | n | %col | |
| Age (years) (V7) | Mean ±SD | 3.35 | ±1.52 | 3.36 | ±1.62 | 3.21 | ±1.4 | 3.49 | ±1.54 |
| Median (Q1-Q3) | 3.2 | (2-4.5) | 3.2 | (1.9-4.6) | 3.1 | (2.1-4.2) | 3.25 | (2.1-4.7) | |
| Sex (V8) | Female | 180 | 50.6 | 54 | 45.4 | 62 | 52.1 | 64 | 54.2 |
| Male | 176 | 49.4 | 65 | 54.6 | 57 | 47.9 | 54 | 45.8 | |
| Total | 356 | 100 | 119 | 33.4 | 119 | 33.4 | 118 | 33.1 | |
| Child weight (kg) (V9) | Mean ±SD | 15.28 | ±4.06 | 15.06 | ±4.21 | 15.1 | ±4.05 | 15.69 | ±3.93 |
| Median (Q1-Q3) | 14.9 | (12-18) | 14.5 | (11.7-17.5) | 14.2 | (11.5-18.2) | 15.5 | (12.7-18.3) | |
| Child height (cm) (V10) | Mean ±SD | 99.48 | ±15.39 | 98.09 | ±13.41 | 99.44 | ±13.89 | 100.93 | ±18.39 |
| Median (Q1-Q3) | 99 | (88-110) | 99 | (87-110) | 98.5 | (89-110) | 99 | (89-110) | |
| Duration of vomiting before enrollment (hours) (V11) | Mean ±SD | 18.9 | ±20.75 | 15.71 | ±17.42 | 20.97 | ±23.02 | 20.05 | ±21.2 |
| Median (Q1-Q3) | 10 | (6-24) | 9 | (5-18) | 10 | (6-24) | 12 | (7-20) | |
| Number of episodes of vomiting in the last 24 hours (V12) | Mean ±SD | 8.47 | ±4.38 | 8.37 | ±3.94 | 8.37 | ±4.46 | 8.69 | ±4.74 |
| Median (Q1-Q3) | 8 | (5.25-10) | 8 | (6-10) | 7 | (5-10) | 8 | (6-10) | |
| Number of episodes of vomiting in the last 6 hours (V13) | Mean ±SD | 5.68 | ±3.53 | 5.92 | ±3.31 | 5.65 | ±3.77 | 5.46 | ±3.52 |
| Median (Q1-Q3) | 5 | (3-7) | 6 | (4-7) | 5 | (3-7) | 5 | (3-7) | |
| Presence of diarrhea (V14) | Yes | 147 | 41.3 | 47 | 39.5 | 51 | 42.9 | 49 | 41.5 |
| No | 209 | 58.7 | 72 | 60.5 | 68 | 57.1 | 69 | 58.5 | |
| Total | 356 | 100 | 119 | 33.4 | 119 | 33.4 | 118 | 33.1 | |
| Drugs taken at home (V15) | Yes | 57 | 16 | 21 | 17.6 | 19 | 16 | 17 | 14.4 |
| No | 299 | 84 | 98 | 82.4 | 100 | 84 | 100 | 85.6 | |
| Total | 356 | 100 | 119 | 33.4 | 119 | 33.4 | 118 | 33.1 | |
| Dehydration score (V16) | Mean ±SD | 8 | ±1.58 | 7.94 | ±1.62 | 8.02 | ±1.52 | 8.03 | ±1.62 |
| Median (Q1-Q3) | 8 | (7-9) | 8 | (7-9) | 8 | (7-9) | 8 | (7-9) | |
| Table 1 : Results – Baseline Characteristics of the Study Patients – Cross sort |
| # Child height (cm) (V10) : 79 unavailable data, 25 individuals whose the “Group ITT (V3)” item is filled “domperidone”, 29 individuals whose the “Group ITT (V3)” item is filled “ondansetron” and 25 individuals whose the “Group ITT (V3)” item is filled “placebo” |
| 2.2. Outcome measures during Emergency Department stay |
| [Top of page] |
| Based on analysis, ondansetron significantly reduces the number of:
– Subjects receiving nasogastric or intravenous rehydration both vs domperidone (OR 0.396, 98.6% CI 0.166 to 0.945) and placebo (OR 0.33, 98.6% CI 0.284 to 0.383); – Subjects needing observation stay for more than 6 hours for the same illness both vs domperidone (OR 0.448, 98.6% CI 0.206 to 0.971) and placebo (OR 0.4, 98.6% CI 0.373 to 0.448); – Subjects with episodes of vomiting during ED stay both vs domperidone (OR 0.252, 98.6% CI 0.118 to 0.535) and placebo (OR 0.285, 98.6% CI 0.254 to 0.317); – Episodes of vomiting during ED stay vs placebo (OR 0.5, 98.6% CI 0.298 to 0.84); – Subjects without success at second ORT attempt both vs domperidone (OR 0.213, 98.6% CI 0.088 to 0.517) and placebo (OR 0.203, 98.6% CI 0.164 to 0.252); – Subjects requiring laboratory tests vs placebo (OR 0.351, 98.6% CI 0.314 to 0.394). |
| Population | Group ITT (V3) | ||||||||
|---|---|---|---|---|---|---|---|---|---|
| _ | domperidone | ondansetron | placebo | ||||||
| N=356 | N=119 | N=119 | N=118 | ||||||
| Mean±SD
Med(Q1Q3) or | Mean±SD
Med(Q1Q3) or | Mean±SD
Med(Q1Q3) or | Mean±SD
Med(Q1Q3) or | ||||||
| Variable | n | %col | n | %col | n | %col | n | %col | |
| Requiring intravenous rehydration (V17) | Yes | 78 | 21.9 | 30 | 25.2 | 14 | 11.8 | 34 | 28.8 |
| No | 278 | 78.1 | 89 | 74.8 | 105 | 88.2 | 84 | 71.2 | |
| Total | 356 | 100 | 119 | 33.4 | 119 | 33.4 | 118 | 33.1 | |
| Observation stay in ED >6 hours (V18) | Yes | 96 | 27 | 37 | 31.1 | 20 | 16.8 | 39 | 33.1 |
| No | 260 | 73 | 82 | 68.9 | 99 | 83.2 | 79 | 66.9 | |
| Total | 356 | 100 | 119 | 33.4 | 119 | 33.4 | 118 | 33.1 | |
| Requiring hospital admission (V19) | Yes | 46 | 12.9 | 16 | 13.4 | 10 | 8.4 | 20 | 16.9 |
| No | 310 | 87.1 | 103 | 86.6 | 109 | 91.6 | 98 | 83.1 | |
| Total | 356 | 100 | 119 | 33.4 | 119 | 33.4 | 118 | 33.1 | |
| Presence of vomiting during ED stay (V20) | Yes | 122 | 34.3 | 53 | 44.5 | 20 | 16.8 | 49 | 41.5 |
| No | 234 | 65.7 | 66 | 55.5 | 99 | 83.2 | 69 | 58.5 | |
| Total | 356 | 100 | 119 | 33.4 | 119 | 33.4 | 118 | 33.1 | |
| Number of episodes of vomiting during ED stay (V21)
N=122 | Mean ±SD | 2.13 | ±1.7 | 2.23 | ±1.8 | 1.4 | ±0.68 | 2.33 | ±1.82 |
| Median (Q1-Q3) | 2 | (1-3) | 2 | (1-3) | 1 | (1-2) | 2 | (1-3) | |
| Success at second ORT attempt (V22) | Yes | 261 | 73.3 | 78 | 65.5 | 107 | 89.9 | 76 | 64.4 |
| No | 95 | 26.7 | 41 | 34.5 | 12 | 10.1 | 42 | 35.6 | |
| Total | 356 | 100 | 119 | 33.4 | 119 | 33.4 | 118 | 33.1 | |
| Requiring laboratory tests (V23) | Yes | 85 | 24.1 | 31 | 26.1 | 17 | 14.3 | 37 | 32.2 |
| No | 268 | 75.9 | 88 | 73.9 | 102 | 85.7 | 78 | 67.8 | |
| Total | 353 | 100 | 119 | 33.7 | 119 | 33.7 | 115 | 32.6 | |
| Presence of diarrhea during ED stay (V24) | Yes | 79 | 22.2 | 26 | 21.8 | 33 | 27.7 | 20 | 16.9 |
| No | 277 | 77.8 | 93 | 78.2 | 86 | 72.3 | 98 | 83.1 | |
| Total | 356 | 100 | 119 | 33.4 | 119 | 33.4 | 118 | 33.1 | |
| Number of episodes of diarrhea during ED stay (V25)
N=79 | Mean ±SD | 2.42 | ±2.22 | 1.88 | ±1.88 | 3.09 | ±2.45 | 2 | ±2.03 |
| Median (Q1-Q3) | 2 | (1-2) | 1 | (1-2) | 2 | (2-4) | 1.5 | (1-2) | |
| Table 2 : Results – Outcome measures during Emergency Department stay – Cross sort |
| # Requiring laboratory tests (V23) : 3 unavailable data, 3 individuals whose the “Group ITT (V3)” item is filled “placebo” |
| Group ITT (V3) | |||
|---|---|---|---|
| ondansetron | placebo | ||
| N=119 | N=118 | ||
| Variable | OR*[98.6%CI] | OR*[98.6%CI] | |
| Requiring intravenous rehydration (V17) | Yes | 0.396[0.166 ; 0.945] | 1.201[0.584 ; 2.467] |
| No | – Ref – domperidone | – Ref – domperidone | |
| Observation stay in ED >6 hours (V18) | Yes | 0.448[0.206 ; 0.971] | 1.094[0.552 ; 2.169] |
| No | – Ref – domperidone | – Ref – domperidone | |
| Requiring hospital admission (V19) | Yes | 0.591[0.207 ; 1.682] | 1.314[0.537 ; 3.213] |
| No | – Ref – domperidone | – Ref – domperidone | |
| Presence of vomiting during ED stay (V20) | Yes | 0.252[0.118 ; 0.535] | 0.884[0.464 ; 1.686] |
| No | – Ref – domperidone | – Ref – domperidone | |
| Number of episodes of vomiting during ED stay (V21)
N=122 | Ref – domperidone
0.516[0.234 ; 1.138] | Ref – domperidone
1.032[0.785 ; 1.355] | |
| Success at second ORT attempt (V22) | Yes | – Ref – domperidone | – Ref – domperidone |
| No | 0.213[0.088 ; 0.517] | 1.051[0.538 ; 2.053] | |
| Requiring laboratory tests (V23) | Yes | 0.473[0.208 ; 1.078] | 1.347[0.662 ; 2.739] |
| No | – Ref – domperidone | – Ref – domperidone | |
| Presence of diarrhea during ED stay (V24) | Yes | 1.372[0.654 ; 2.882] | 0.730[0.324 ; 1.645] |
| No | – Ref – domperidone | – Ref – domperidone | |
| Number of episodes of diarrhea during ED stay (V25)
N=79 | Ref – domperidone
1.332[0.899 ; 1.974] | Ref – domperidone
1.053[0.647 ; 1.713] | |
| *OR : Odds Ratio | |||
| Table 3 : Results – Outcome measures during Emergency Department stay – Association strengths |
| 2.3. Outcome measures at telephone follow up |
| [Top of page] |
| No statistically significant differences are seen among the three groups for subjects readmitted in ED for the same illness, subjects with episodes of vomiting and diarrhea in the 48 hours follow-up and number of episode of vomiting and diarrhea in the last 24 hours of follow-up. |
| Population | Group ITT (V3) | ||||||||
|---|---|---|---|---|---|---|---|---|---|
| _ | domperidone | ondansetron | placebo | ||||||
| N=356 | N=119 | N=119 | N=118 | ||||||
| Mean±SD
Med(Q1Q3) or | Mean±SD
Med(Q1Q3) or | Mean±SD
Med(Q1Q3) or | Mean±SD
Med(Q1Q3) or | ||||||
| Variable | n | %col | n | %col | n | %col | n | %col | |
| Readmitted to ED after discharge (V27) | Yes | 36 | 10.2 | 12 | 10.1 | 11 | 9.3 | 13 | 11.1 |
| No | 318 | 89.8 | 107 | 89.9 | 107 | 90.7 | 104 | 88.9 | |
| Total | 354 | 100 | 119 | 33.6 | 118 | 33.3 | 117 | 33.1 | |
| Episodes of vomiting during 48 h f-up (V28) | Yes | 104 | 29.4 | 27 | 22.7 | 36 | 30.5 | 41 | 35 |
| No | 250 | 70.6 | 92 | 77.3 | 82 | 69.5 | 76 | 65 | |
| Total | 354 | 100 | 119 | 33.6 | 118 | 33.3 | 117 | 33.1 | |
| Number of episodes of vomiting in the last 24 hours of f-up (V29)
N=104 | Mean ±SD | 2.38 | ±1.91 | 2.54 | ±2.08 | 2.25 | ±1.71 | 2.37 | ±1.97 |
| Median (Q1-Q3) | 2 | (1-3) | 2 | (1-3) | 1 | (1-3) | 1.5 | (1-3) | |
| Episodes of diarrhea during 48 h f-up (V30) | Yes | 144 | 40.7 | 51 | 42.9 | 49 | 41.5 | 44 | 37.6 |
| No | 210 | 59.3 | 68 | 57.1 | 69 | 58.5 | 73 | 62.4 | |
| Total | 354 | 100 | 119 | 33.6 | 118 | 33.3 | 117 | 33.1 | |
| Number of episodes of diarrhea in the last 24 hours of f-up (V31)
N=144 | Mean ±SD | 4.44 | ±6.3 | 3.93 | ±3.95 | 4.82 | ±7.77 | 4.66 | ±6.93 |
| Median (Q1-Q3) | 3 | (2-4) | 3 | (2-4) | 3 | (2-4) | 3 | (1-5) | |
| Table 4 : Results – Outcome measures at telephone follow up – Cross sort |
| # Readmitted to ED after discharge (V27) : 2 unavailable data, 1 individual whose the “Group ITT (V3)” item is filled “ondansetron” and 1 individual whose the “Group ITT (V3)” item is filled “placebo” |
| # Episodes of vomiting during 48 h f-up (V28) : 2 unavailable data, 1 individual whose the “Group ITT (V3)” item is filled “ondansetron” and 1 individual whose the “Group ITT (V3)” item is filled “placebo” |
| # Number of episodes of vomiting in the last 24 hours of f-up (V29) : 13 unavailable data, 6 individuals whose the “Group ITT (V3)” item is filled “ondansetron” and 7 individuals whose the “Group ITT (V3)” item is filled “placebo” |
| # Episodes of diarrhea during 48 h f-up (V30) : 2 unavailable data, 1 individual whose the “Group ITT (V3)” item is filled “ondansetron” and 1 individual whose the “Group ITT (V3)” item is filled “placebo” |
| # Number of episodes of diarrhea in the last 24 hours of f-up (V31) : 6 unavailable data, 3 individuals whose the “Group ITT (V3)” item is filled “ondansetron” and 3 individuals whose the “Group ITT (V3)” item is filled “placebo” |
| Group ITT (V3) | |||
|---|---|---|---|
| ondansetron | placebo | ||
| N=119 | N=118 | ||
| Variable | OR*[98.6%CI] | OR*[98.6%CI] | |
| Readmitted to ED after discharge (V27) | Yes | 0.917[0.312 ; 2.697] | 1.115[0.394 ; 3.154] |
| No | – Ref – domperidone | – Ref – domperidone | |
| Episodes of vomiting during 48 h f-up (V28) | Yes | 1.496[0.722 ; 3.099] | 1.838[0.896 ; 3.770] |
| No | – Ref – domperidone | – Ref – domperidone | |
| Number of episodes of vomiting in the last 24 hours of f-up (V29)
N=104 | Ref – domperidone
0.923[0.653 ; 1.305] | Ref – domperidone
0.957[0.692 ; 1.322] | |
| Episodes of diarrhea during 48 h f-up (V30) | Yes | 0.947[0.496 ; 1.807] | 0.804[0.418 ; 1.545] |
| No | – Ref – domperidone | – Ref – domperidone | |
| Number of episodes of diarrhea in the last 24 hours of f-up (V31)
N=144 | Ref – domperidone
1.025[0.940 ; 1.119] | Ref – domperidone
1.022[0.933 ; 1.119] | |
| *OR : Odds Ratio | |||
| Table 5 : Results – Outcome measures at telephone follow up – Association strengths |
| Tables and figures |
| Table 1 : Results – Baseline Characteristics of the Study Patients – Cross sort |
| Table 2 : Results – Outcome measures during Emergency Department stay – Cross sort |
| Table 3 : Results – Outcome measures during Emergency Department stay – Association strengths |
| Table 4 : Results – Outcome measures at telephone follow up – Cross sort |
| Table 5 : Results – Outcome measures at telephone follow up – Association strengths |
| Figure 1 : Study profile – Flowchart – Flowchart |
| Date of completion : 13 April 2021 |
| Implementer : RUS |
| Software version 0.1 |