| [2007-001094-29] The HER2 phenotype of circulating tumor cells in HER2-positive early breast cancer : A translational research project of a prospective randomized phase III trial.
Jaeger BAS, Neugebauer J, Andergassen U, Melcher C, Schochter F, Mouarrawy D, et al. Source : PLOS ONE | https://doi.org/10.1371/journal.pone.0173593 Download “Table 2007-001094-29-her2” 2007-001094-29-her2.zip – Downloaded 4 times – 1.72 MB Copyright : Unrestricted use of report data provided the original author and source are credited (raw royalty-free data). |
| Summary |
| Methods |
| Objective:
Aim of the study is to assess potential discordance of HER2 status between primary tumor and CTCs, as this may have important implications for the use of HER2-targeted therapy. Assessment: Performed as a predefined translational research project of the SUCCES B trial (2008-2011) including 129 participating centers in Germany, this study analyzed the HER2 status of CTCs in patients with HER2-positive primary breast cancer at the time of diagnosis. The number and HER2 status of CTCs out of 30ml peripheral blood were assessed in 642 patients using the CellSearch System (Jenssen Diagnostics, USA). Primary outcome criteria is HER2 positivity of CTCs. The cutoff for CTC positivity is the presence of at least 1 CTC. The cutoff for HER2 positivity of CTCs is the presence of at least 1 CTC with a strong HER2 staining. Secondary outcomes are (i) pT and pN that assess the tumor size, (ii) histologie with histopathological grading, (iii) estrogen and progesterone receptor status, (iv) menopause status, (v) age and (vi) chemotherapy. Study principles: Parameters are described according to presence of CTCs. Qualitative variables are described with frequencies and level percentages (Row percentages here). The association between a parameter and ‘Presence of CTCs (CTC)’ or ‘CTC-positive (HER2)’ items was evaluated with Khi2(K2) test or Fisher(Fs) exact test when the conditions of validity were not respected. Missing data is not counted. To evaluate the association strength of the parameters on HER2 positivity of CTCs, a multivariate logistic regression model with presence of HER2 CTCs as binary response variable was established. The association strength was evaluated using Odds Ratios with 95% confidence intervals and Wald statistic. The effect of each parameter was measured independently of the others. |
| Codings and variables generated following the freeze of the database | |
|---|---|
| Original variable(s) | Created variable |
| Age (AGE) | Age (AGE00) resulting from a discretisation :
– 1 : [19 ; 50[ – 2 : [50 ; 81] |
| CTCs number (CTC_NUMBER) | Presence of CTCs (CTC) resulting from a conditioning (on CTC_NUMBER) :
– CTC-negative – CTC-positive |
| CTCs number (CTC_NUMBER) | |
| HER2-moderate positive CTCs (CTC_HER2PP_NUMBER) | |
| HER2-negative CTCs (CTC_HER2N_NUMBER) | |
| HER2-strong positive CTCs (CTC_HER2PPP_NUMBER) | |
| HER2-weak positive CTCs (CTC_HER2P_NUMBER) | HER2 status of CTCs (CTC2BISBISBIS) resulting from a nominalization :
– 1 : No CTCs detected – 2 : Negative for HER2 staining – 3 : Weak HER2 staining – 4 : Moderate HER2 staining – 5 : Strong HER2 staining |
| CTCs number (CTC_NUMBER) | Number of CTCs (CTC3) resulting from a conditioning (on CTC_NUMBER) :
– 1 – 2 – 3 – 4 – >4 |
| CTCs number (CTC_NUMBER) | |
| HER2-strong positive CTCs (CTC_HER2PPP_NUMBER) | CTC-positive (HER2) resulting from a conditioning (on CTC_HER2PPP_NUMBER CTC_NUMBER) :
– At least one HER2-positive CTC – Only HER2-negative CTCs |
| Table 1 : Encodings |
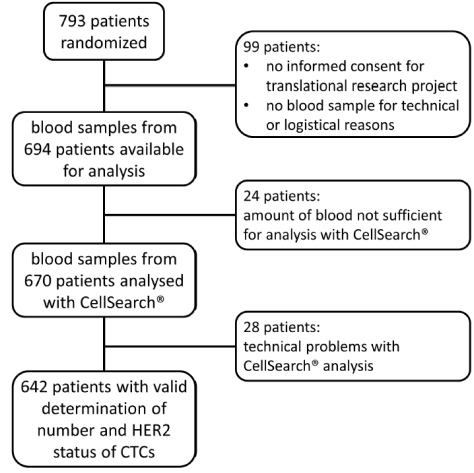
| 1. Study profile |
| 1.1. Flowchart |
| [Top of page] |
| HER2 phenotype of circulating tumor cells in breast cancer |
| Valid measurements of the presence and HER2 status of CTCs before adjuvant chemotherapy were available for 642 patients. |
| 2. Results |
| 2.1. Associations with presence of CTCs |
| [Top of page] |
| No association is highlighted between the ‘Presence of CTCs (CTC)’ item and tumor size / axillary lymph node involvement (p = 0.4802 / p = 0.5098), histopathological grading (p = 0.8371), hormone receptor status (ER: p = 0.9242, PR: p = 0.9863) and menopause (p = 0.3397). |
| Population | Presence of CTCs (CTC) | |||||||
|---|---|---|---|---|---|---|---|---|
| _ | CTC-negative | CTC-positive | ||||||
| N=642 | N=384 | N=258 | Statistic | |||||
| Variable | n | %col | n | %row | n | %row | p | |
| PT (STADIUM_T) | pT1 | 310 | 50.2 | 190 | 61.3 | 120 | 38.7 | Fs p = 0.4802 |
| pT2 | 273 | 44.2 | 154 | 56.4 | 119 | 43.6 | ||
| pT3 | 25 | 4.1 | 16 | 64 | 9 | 36 | ||
| pT4 | 9 | 1.5 | 4 | 44.4 | 5 | 55.6 | ||
| Total | 617 | 100 | 364 | 59 | 253 | 41 | ||
| PN (STADIUM_N) | pN+ | 278 | 45.1 | 160 | 57.6 | 118 | 42.4 | K2 p = 0.5098 |
| pN0 | 339 | 54.9 | 204 | 60.2 | 135 | 39.8 | ||
| Total | 617 | 100 | 364 | 59 | 253 | 41 | ||
| HISTOLOGIE | Invasive ductal | 246 | 38.3 | 137 | 55.7 | 109 | 44.3 | K2 p = 0.2151 |
| Invasive lobular | 26 | 4 | 15 | 57.7 | 11 | 42.3 | ||
| Other invasive epithelial breast cancer | 370 | 57.6 | 232 | 62.7 | 138 | 37.3 | ||
| Total | 642 | 100 | 384 | 59.8 | 258 | 40.2 | ||
| GRADING | G1 (well differentiated) | 7 | 1.1 | 5 | 71.4 | 2 | 28.6 | Fs p = 0.8371 |
| G2 (moderately differentiated) | 244 | 38 | 147 | 60.2 | 97 | 39.8 | ||
| G3 (poor differentiated) | 391 | 60.9 | 232 | 59.3 | 159 | 40.7 | ||
| Total | 642 | 100 | 384 | 59.8 | 258 | 40.2 | ||
| ER status (ESTRO_STATUS) | ER- | 237 | 38.4 | 140 | 59.1 | 97 | 40.9 | K2 p = 0.9242 |
| ER+ | 380 | 61.6 | 223 | 58.7 | 157 | 41.3 | ||
| Total | 617 | 100 | 363 | 58.8 | 254 | 41.2 | ||
| PR status (PROG_STATUS) | PR- | 272 | 44.2 | 160 | 58.8 | 112 | 41.2 | K2 p = 0.9863 |
| PR+ | 343 | 55.8 | 202 | 58.9 | 141 | 41.1 | ||
| Total | 615 | 100 | 362 | 58.9 | 253 | 41.1 | ||
| Menopause (MENO) | post | 400 | 62.3 | 245 | 61.3 | 155 | 38.8 | K2 p = 0.3397 |
| pre | 242 | 37.7 | 139 | 57.4 | 103 | 42.6 | ||
| Total | 642 | 100 | 384 | 59.8 | 258 | 40.2 | ||
| Age (AGE00) | [19 ; 50[ | 214 | 33.3 | 118 | 55.1 | 96 | 44.9 | K2 p = 0.0877 |
| [50 ; 81] | 428 | 66.7 | 266 | 62.1 | 162 | 37.9 | ||
| Total | 642 | 100 | 384 | 59.8 | 258 | 40.2 | ||
| Chemotherapy (CHEMOTHERAPY) | FEC/Docetaxel | 325 | 50.6 | 195 | 60 | 130 | 40 | K2 p = 0.9221 |
| FEC/Docetaxel plus Gemcitabine | 317 | 49.4 | 189 | 59.6 | 128 | 40.4 | ||
| Total | 642 | 100 | 384 | 59.8 | 258 | 40.2 | ||
| K2 : Khi2, Fs : Fisher | ||||||||
| Table 2 : Results – Associations with presence of CTCs – Cross sort |
| # PT (STADIUM_T) : 25 unavailable data, 20 individuals whose the “Presence of CTCs (CTC)” item is filled “CTC-negative” and 5 individuals whose the “Presence of CTCs (CTC)” item is filled “CTC-positive” |
| # PN (STADIUM_N) : 25 unavailable data, 20 individuals whose the “Presence of CTCs (CTC)” item is filled “CTC-negative” and 5 individuals whose the “Presence of CTCs (CTC)” item is filled “CTC-positive” |
| # ER status (ESTRO_STATUS) : 25 unavailable data, 21 individuals whose the “Presence of CTCs (CTC)” item is filled “CTC-negative” and 4 individuals whose the “Presence of CTCs (CTC)” item is filled “CTC-positive” |
| # PR status (PROG_STATUS) : 27 unavailable data, 22 individuals whose the “Presence of CTCs (CTC)” item is filled “CTC-negative” and 5 individuals whose the “Presence of CTCs (CTC)” item is filled “CTC-positive” |
| 2.2. Distribution of samples according to CTC status and the highest HER2 staining intensity of CTCs in the samples |
| [Top of page] |
| The HER2 status of CTCs was assessed for all 258 CTC-positive patients.
Of these patients, 149 had at least one CTC with strong HER2 staining and were classified as having HER2-positive CTCs according to cutoff criterion. Of the CTC-positive patients, 109 had no CTCs with strong HER2 staining: 55 had at least one CTC with moderate HER2 staining, 23 had no CTCs with moderate HER2 staining but at least one CTC with weak HER2 staining, and 31 were exclusively HER2-negative CTC. |
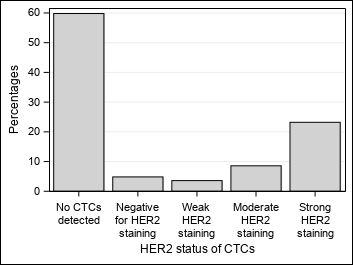 |
| Figure 2 : Results – Distribution of samples according to CTC status and the highest HER2 staining intensity of CTCs in the samples – Graphics |
| 2.3. Associations with presence of HER2 CTCs |
| [Top of page] |
| No association is highlighted between the ‘CTC-positive (HER2)’ item and tumor size / axillary lymph node involvement (p = 0.3721 / p = 0.4298), histopathological grading (p = 0.9492), hormone receptor status (ER: p = 0.6262, PR: p = 0.2631).
However, patients with ductal or lobular invasive breast cancer are less likely to have HER2-positive CTCs than the others (p = 0.0394) and pre-menopausal patients are more likely to have HER2-positive CTCs than post-menopausal patients (p = 0.0284). |
| Population | CTC-positive (HER2) | |||||||
|---|---|---|---|---|---|---|---|---|
| _ | At least one HER2-positive CTC | Only HER2-negative CTCs | ||||||
| N=258 | N=149 | N=109 | Statistic | |||||
| Variable | n | %col | n | %row | n | %row | p | |
| PT (STADIUM_T) | pT1 | 120 | 47.4 | 69 | 57.5 | 51 | 42.5 | Fs p = 0.3721 |
| pT2 | 119 | 47 | 71 | 59.7 | 48 | 40.3 | ||
| pT3 | 9 | 3.6 | 6 | 66.7 | 3 | 33.3 | ||
| pT4 | 5 | 2 | 1 | 20 | 4 | 80 | ||
| Total | 253 | 100 | 147 | 58.1 | 106 | 41.9 | ||
| PN (STADIUM_N) | pN+ | 118 | 46.6 | 65 | 55.1 | 53 | 44.9 | K2 p = 0.4298 |
| pN0 | 135 | 53.4 | 81 | 60 | 54 | 40 | ||
| Total | 253 | 100 | 146 | 57.7 | 107 | 42.3 | ||
| HISTOLOGIE | Invasive ductal | 109 | 42.2 | 56 | 51.4 | 53 | 48.6 | Fs p = 0.0394 |
| Invasive lobular | 11 | 4.3 | 4 | 36.4 | 7 | 63.6 | ||
| Other invasive epithelial breast cancer | 138 | 53.5 | 89 | 64.5 | 49 | 35.5 | ||
| Total | 258 | 100 | 149 | 57.8 | 109 | 42.2 | ||
| GRADING | G1 (well differentiated) | 2 | 0.8 | 1 | 50 | 1 | 50 | Fs p = 0.9492 |
| G2 (moderately differentiated) | 97 | 37.6 | 57 | 58.8 | 40 | 41.2 | ||
| G3 (poor differentiated) | 159 | 61.6 | 91 | 57.2 | 68 | 42.8 | ||
| Total | 258 | 100 | 149 | 57.8 | 109 | 42.2 | ||
| ER status (ESTRO_STATUS) | ER- | 97 | 38.2 | 58 | 59.8 | 39 | 40.2 | K2 p = 0.6262 |
| ER+ | 157 | 61.8 | 89 | 56.7 | 68 | 43.3 | ||
| Total | 254 | 100 | 147 | 57.9 | 107 | 42.1 | ||
| PR status (PROG_STATUS) | PR- | 112 | 44.3 | 69 | 61.6 | 43 | 38.4 | K2 p = 0.2631 |
| PR+ | 141 | 55.7 | 77 | 54.6 | 64 | 45.4 | ||
| Total | 253 | 100 | 146 | 57.7 | 107 | 42.3 | ||
| Menopause (MENO) | post | 155 | 60.1 | 81 | 52.3 | 74 | 47.7 | K2 p = 0.0284 |
| pre | 103 | 39.9 | 68 | 66 | 35 | 34 | ||
| Total | 258 | 100 | 149 | 57.8 | 109 | 42.2 | ||
| Age (AGE00) | [19 ; 50[ | 96 | 37.2 | 60 | 62.5 | 36 | 37.5 | K2 p = 0.2346 |
| [50 ; 81] | 162 | 62.8 | 89 | 54.9 | 73 | 45.1 | ||
| Total | 258 | 100 | 149 | 57.8 | 109 | 42.2 | ||
| Chemotherapy (CHEMOTHERAPY) | FEC/Docetaxel | 130 | 50.4 | 70 | 53.8 | 60 | 46.2 | K2 p = 0.2006 |
| FEC/Docetaxel plus Gemcitabine | 128 | 49.6 | 79 | 61.7 | 49 | 38.3 | ||
| Total | 258 | 100 | 149 | 57.8 | 109 | 42.2 | ||
| K2 : Khi2, Fs : Fisher | ||||||||
| Table 3 : Results – Associations with presence of HER2 CTCs – Cross sort |
| # PT (STADIUM_T) : 5 unavailable data, 2 individuals whose the “CTC-positive (HER2)” item is filled “At least one HER2-positive CTC” and 3 individuals whose the “CTC-positive (HER2)” item is filled “Only HER2-negative CTCs” |
| # PN (STADIUM_N) : 5 unavailable data, 3 individuals whose the “CTC-positive (HER2)” item is filled “At least one HER2-positive CTC” and 2 individuals whose the “CTC-positive (HER2)” item is filled “Only HER2-negative CTCs” |
| # ER status (ESTRO_STATUS) : 4 unavailable data, 2 individuals whose the “CTC-positive (HER2)” item is filled “At least one HER2-positive CTC” and 2 individuals whose the “CTC-positive (HER2)” item is filled “Only HER2-negative CTCs” |
| # PR status (PROG_STATUS) : 5 unavailable data, 3 individuals whose the “CTC-positive (HER2)” item is filled “At least one HER2-positive CTC” and 2 individuals whose the “CTC-positive (HER2)” item is filled “Only HER2-negative CTCs” |
| 2.4. Results of a multivariate logistic regression model with presence of HER2 CTCs as binary response variable |
| [Top of page] |
| The multivariate logistic regression analysis confirmed the results as to the presence of HER2-positive CTCs as binary response variable. |
| CTC-positive (HER2) | |||
|---|---|---|---|
| N=258 | n=251 | ||
| Explanatory variables | OR*[95%CI] | Wd p | |
| PT (STADIUM_T) | pT1 | 1.151[0.670 ; 1.978] | 0.3768 |
| pT2 | 1 | ||
| pT3 | 0.507[0.098 ; 2.625] | ||
| pT4 | 5.395[0.557 ; 52.28] | ||
| PN (STADIUM_N) | pN+ | 1.156[0.676 ; 1.977] | 0.5961 |
| pN0 | 1 | ||
| HISTOLOGIE | Invasive ductal | 1.775[1.024 ; 3.076] | 0.0287 |
| Invasive lobular | 4.366[1.042 ; 18.30] | ||
| Other invasive epithelial breast cancer | 1 | ||
| GRADING | G1 (well differentiated) | 0.563[0.029 ; 11.13] | 0.8642 |
| G2 (moderately differentiated) | 0.882[0.495 ; 1.571] | ||
| G3 (poor differentiated) | 1 | ||
| ER status (ESTRO_STATUS) | ER- | 1.096[0.503 ; 2.385] | 0.8180 |
| ER+ | 1 | ||
| PR status (PROG_STATUS) | PR- | 0.686[0.317 ; 1.482] | 0.3373 |
| PR+ | 1 | ||
| Menopause (MENO) | post | 1 | 0.0456 |
| pre | 0.401[0.164 ; 0.982] | ||
| Age (AGE00) | [19 ; 50[ | 1.465[0.586 ; 3.663] | 0.4141 |
| [50 ; 81] | 1 | ||
| Chemotherapy (CHEMOTHERAPY) | FEC/Docetaxel | 1 | 0.1368 |
| FEC/Docetaxel plus Gemcitabine | 0.668[0.392 ; 1.137] | ||
| Wd : Wald *OR : Odds Ratio | |||
| Table 4 : Results – Results of a multivariate logistic regression model with presence of HER2 CTCs as binary response variable – Association strengths in multivariate analysis |
| 2.5. Prevalence of HER2 positive CTCs in relation to the number of CTCs detected in the blood samples |
| [Top of page] |
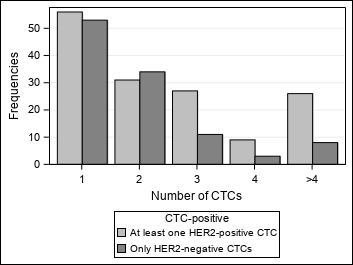 |
| Figure 3 : Results – Prevalence of HER2 positive CTCs in relation to the number of CTCs detected in the blood samples – Graphics |
| Tables and figures |
| Table 1 : Encodings |
| Table 2 : Results – Associations with presence of CTCs – Cross sort |
| Table 3 : Results – Associations with presence of HER2 CTCs – Cross sort |
| Table 4 : Results – Results of a multivariate logistic regression model with presence of HER2 CTCs as binary response variable – Association strengths in multivariate analysis |
| Figure 1 : Study profile – Flowchart – HER2 phenotype of circulating tumor cells in breast cancer |
| Figure 2 : Results – Distribution of samples according to CTC status and the highest HER2 staining intensity of CTCs in the samples – Graphics |
| Figure 3 : Results – Prevalence of HER2 positive CTCs in relation to the number of CTCs detected in the blood samples – Graphics |
| Date of completion : 31 January 2021 |
| Implementer : RUS |
| Software version 0.1 |